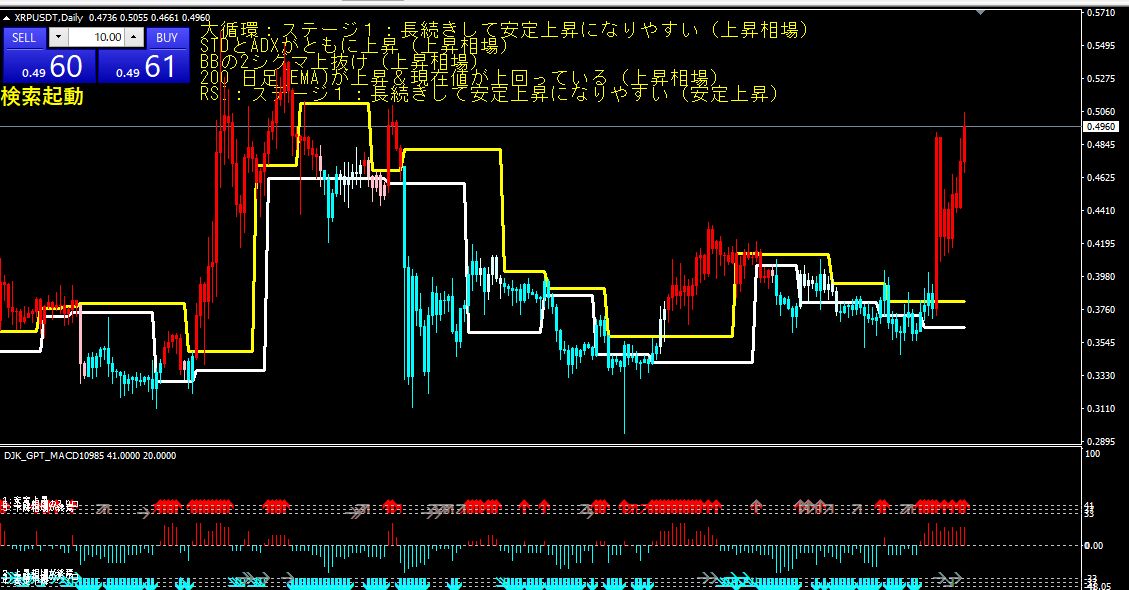
XRPUSDT Daily chart March 29 1:08 Buy
The following conditions are currently being met.
- The standard deviation range and ADX are both rising, indicating a bullish uptrend.
- BB has broken above the 2-sigma line, producing a buy signal.
- The 200-day (EMA) is rising, and since the current price is above it, the long-term trend appears to be bullish.
- The RSI is in Stage 1, suggesting a tendency to continue rising steadily.
- The Major Cycle is also in Stage 1, indicating a tendency to continue rising steadily.
From these conditions, a buying decision is considered appropriate.
However, since the 1-sigma band of the BB is expanding,
volatility is high and there is a possibility of rapid market changes, so caution is required.
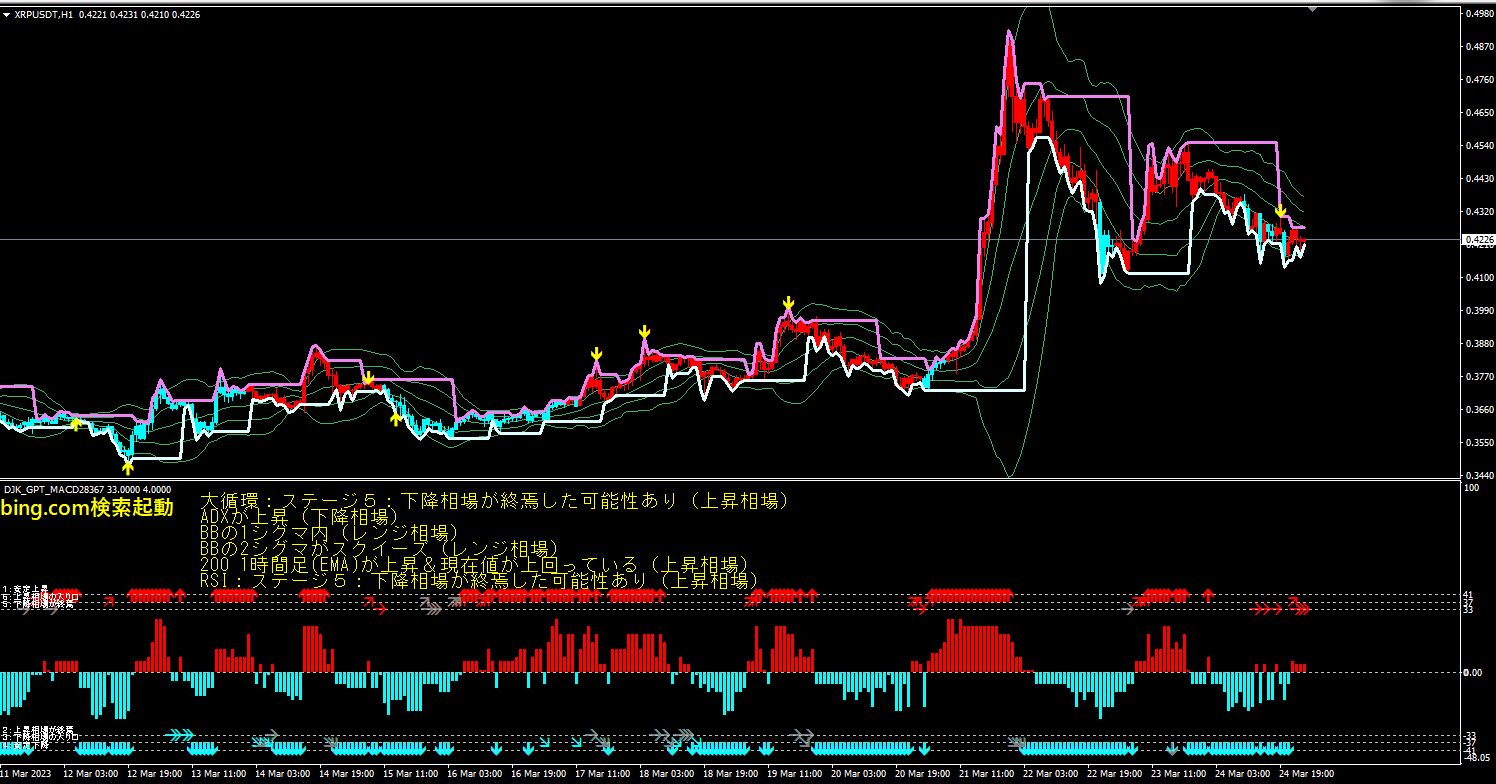
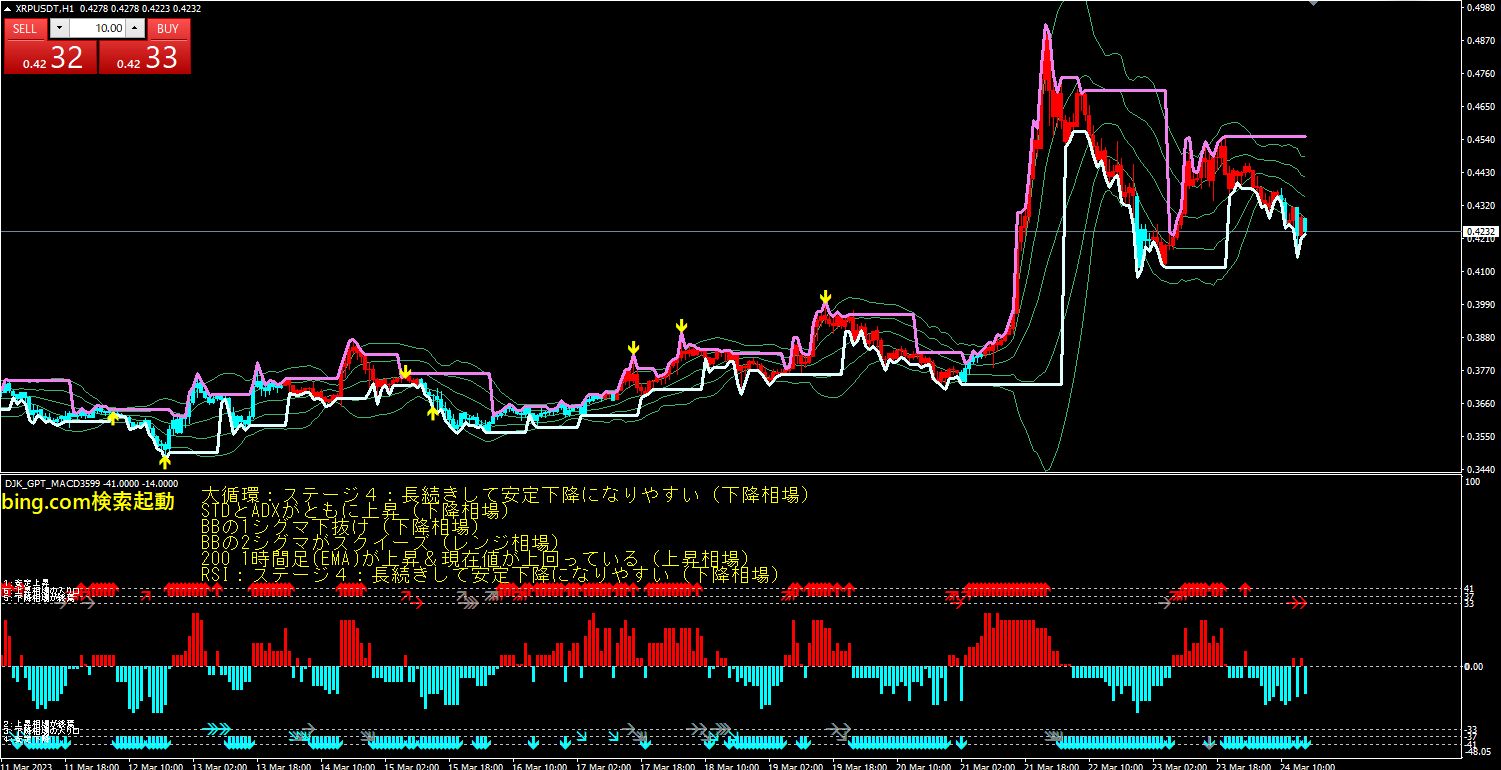
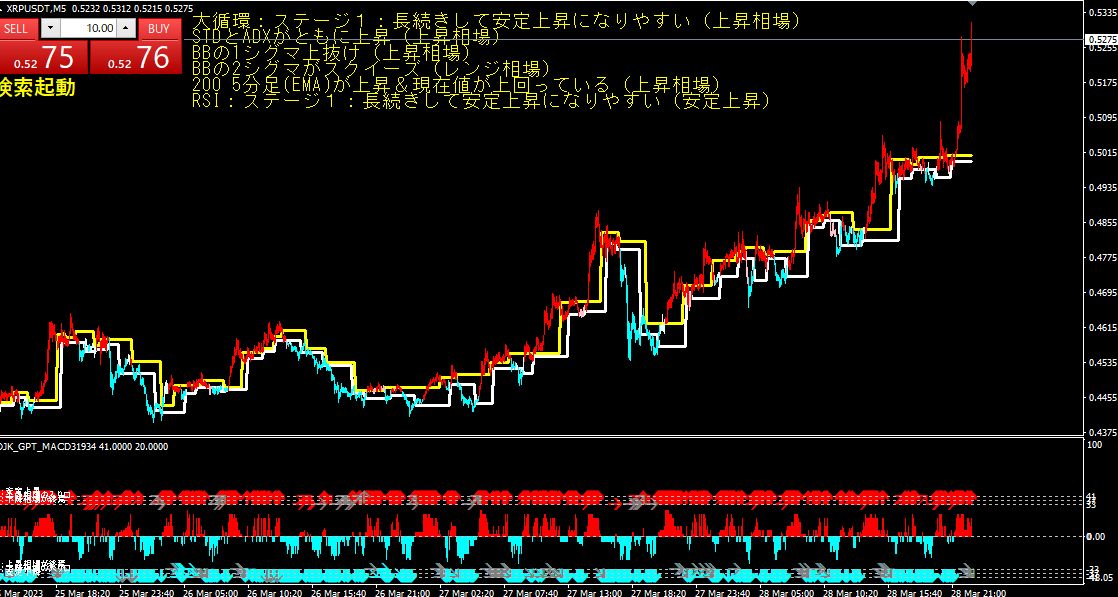
The timing for buying and selling can be determined using
the Bollinger Bands (parameter: 21).
In the current chart, the central line of the Bollinger Bands can be used as
a support level.
If the price breaks below the central line, it becomes a sell signal.
Conversely, if it breaks above the central line, it becomes a buy signal.
Additionally, if the price approaches the upper or lower band of the Bollinger Bands,
the likelihood of a rebound increases, making it a potential moment for taking profits or cutting losses.
This can be considered as a timing guide for taking profits or stopping losses.
× ![]()