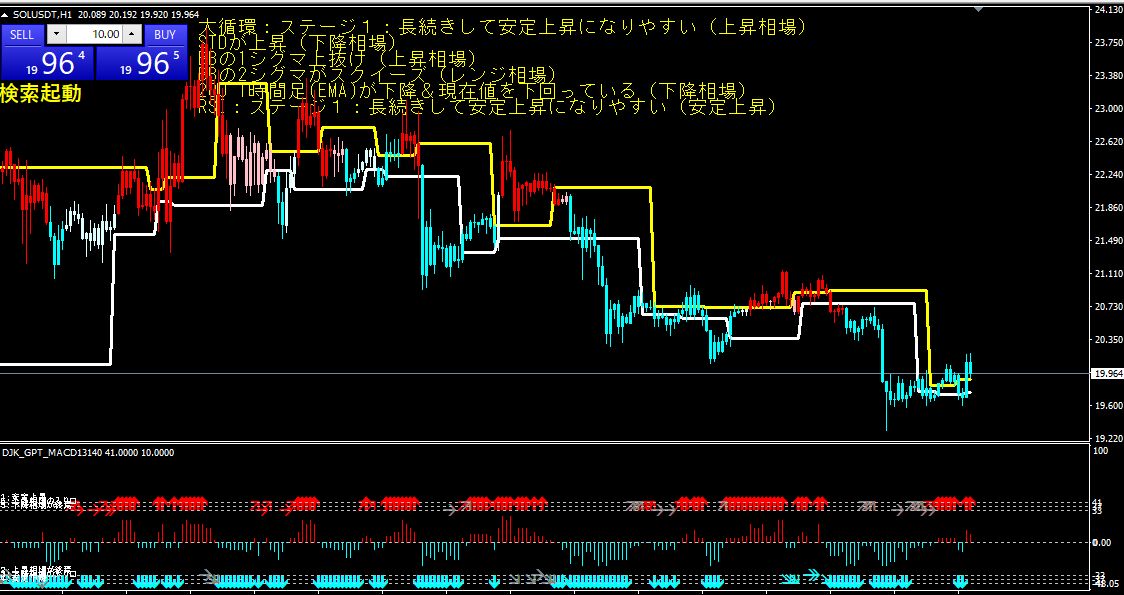
SOLUSDT 1-hour chart March 28 21:31 Status quo
Looking at the 1-hour chart, as of 21:31 on March 28, SOLUSDT is trading at $19.80.
Standard deviation range and ADX are both rising,
and with BB breaking 1 sigma to the upside and 2 sigma Bollinger Bands squeezing,
we can判断 (note: keep as "we can conclude") that there is strong market momentum.
However, the 200 1-hour EMA is declining and currently below the price,
so it is likely a temporary rally within a downtrend.
Therefore, RSI is in stage 1 and the MACRO cycle is also in stage 1,
which is said to favor prolonged and stable upside moves, but
it may still be too early for a trend reversal to the upside.
Hence, for trading decisions, there is strong upside momentum at present, but
we should remain aware that we are in a downtrend and assess cautiously.
One option is to wait for a signal to switch to a selling position, or
to stay on the sidelines until there is confidence in a trend reversal to the upside.
× ![]()