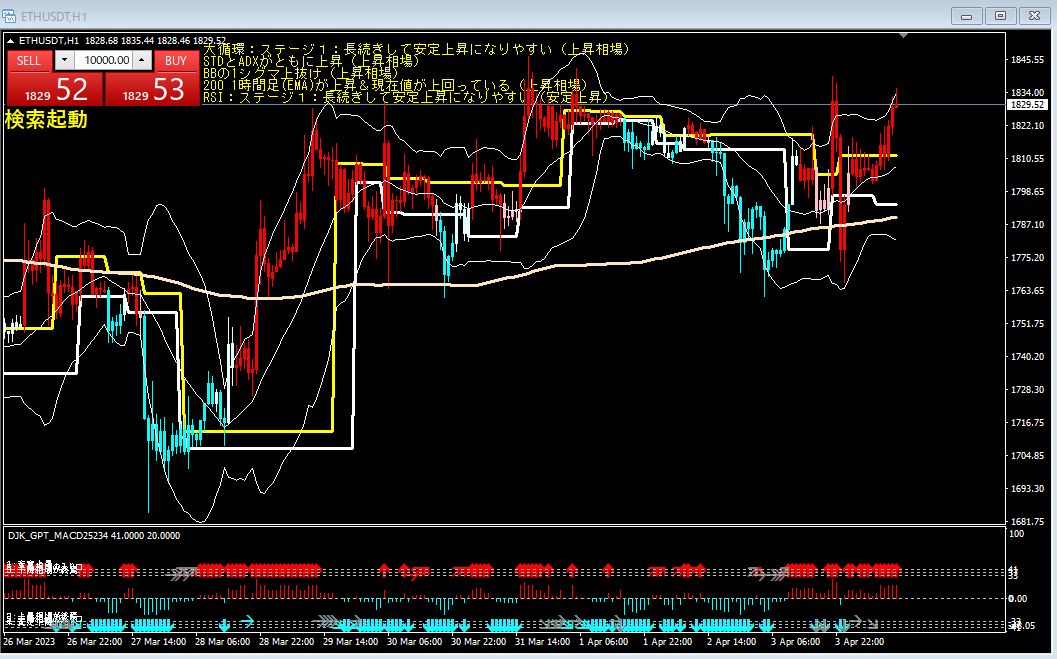
ETHUSDT 1-hour chart March 28 21:21 Bear market
The standard deviation range has been rising,
which indicates increased price volatility and market instability.
A close above 2 standard deviations of the BB suggests the price is exceeding the upper band,
and it is a sell signal.
With the 200-hour EMA turning down and currently below the price,
this implies a downward price trend.
The RSI is rising steadily and is in Stage 1,
so it is not a buy signal.
Since the broader cycle is in Stage 1, the ETH/USDT pair
is suggested to be in an overall upward trend over the long term, but
given the current conditions, a short-term decline is considered more likely.
× ![]()