Today's Scenario GBP/USD
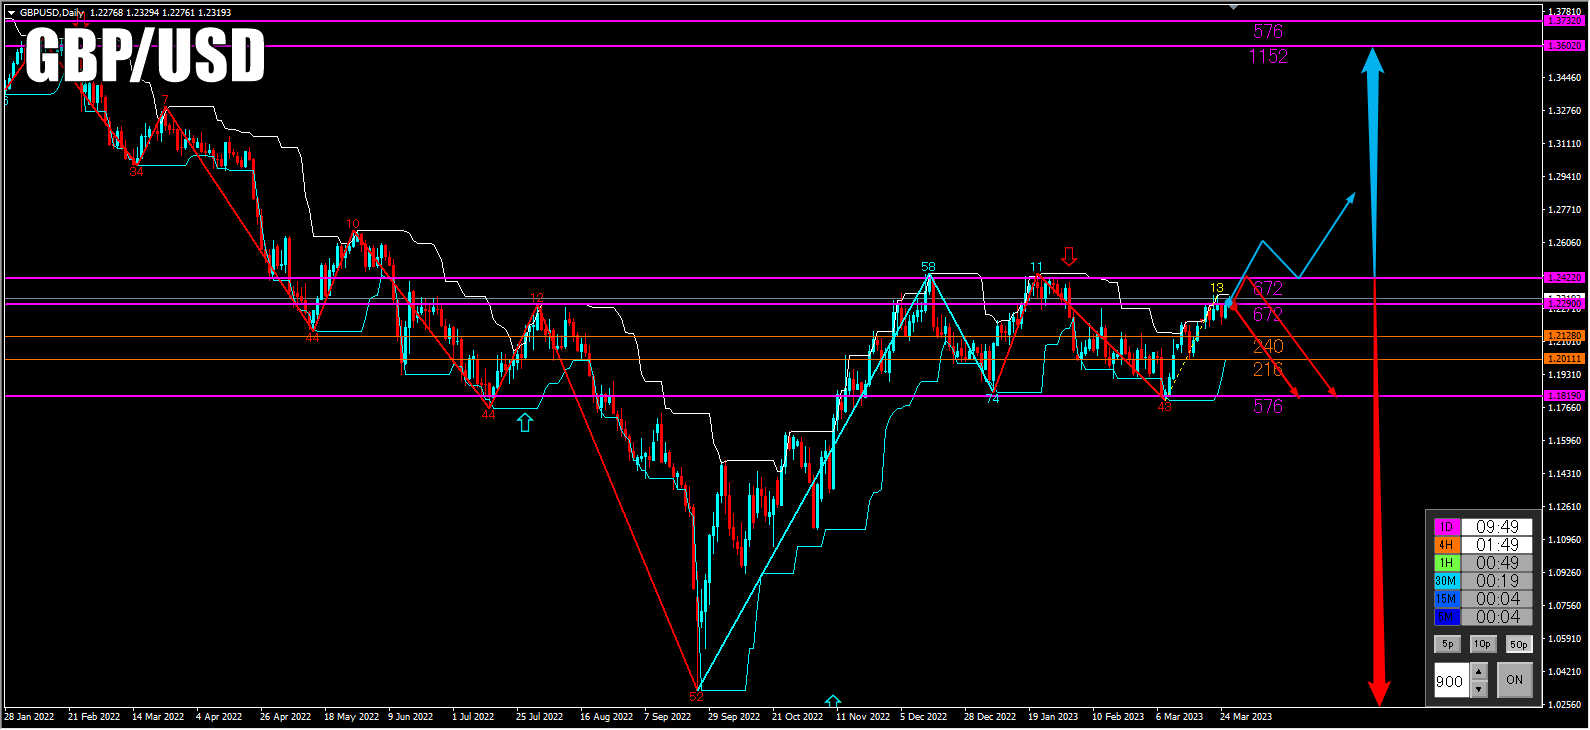
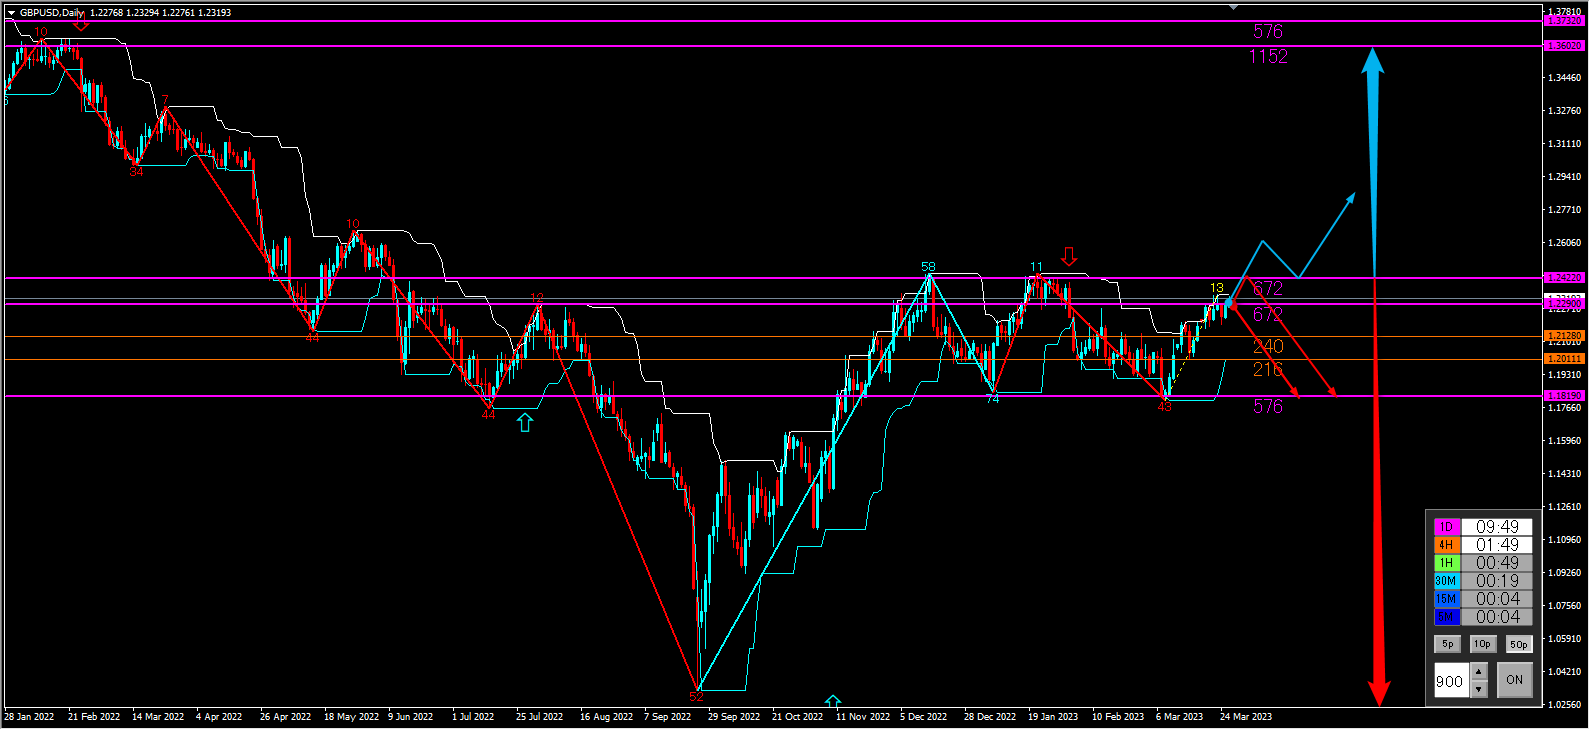
GBP/USD Daily Chart
In the daily chart, over the last three months the purple lines that act as price levels on the daily chart (576) to (672) have been moving up and down.
At present, it is at the purple line (672) and whether it will rebound and fall, or rise to one more purple line higher is the two options.
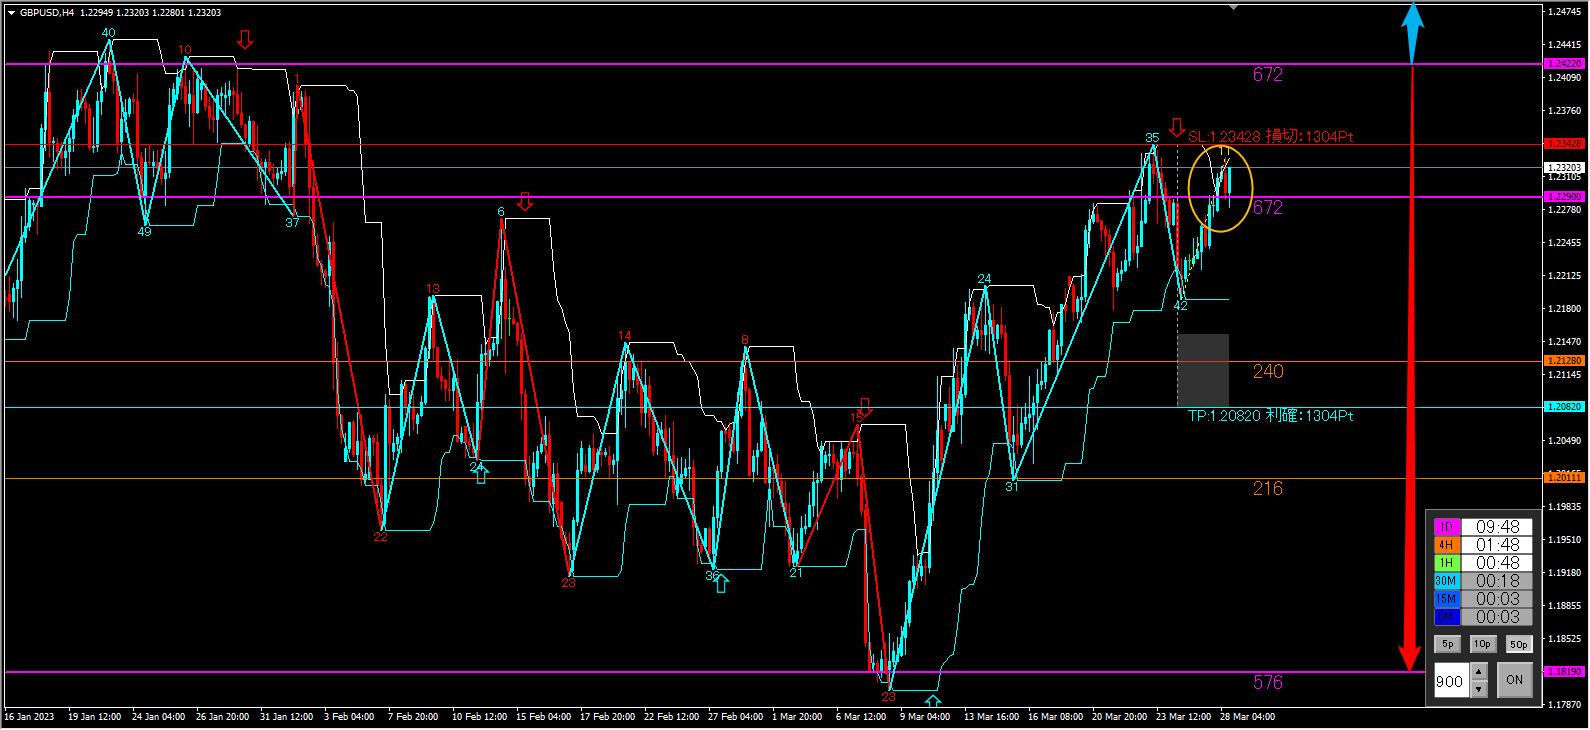
4-Hour Chart
On the 4-hour chart, at the present moment it is crossing over the purple line (672) that is watched on the daily chart.
From here, will it rise one step higher, or break below to start a downward move? It is difficult to judge at this point.

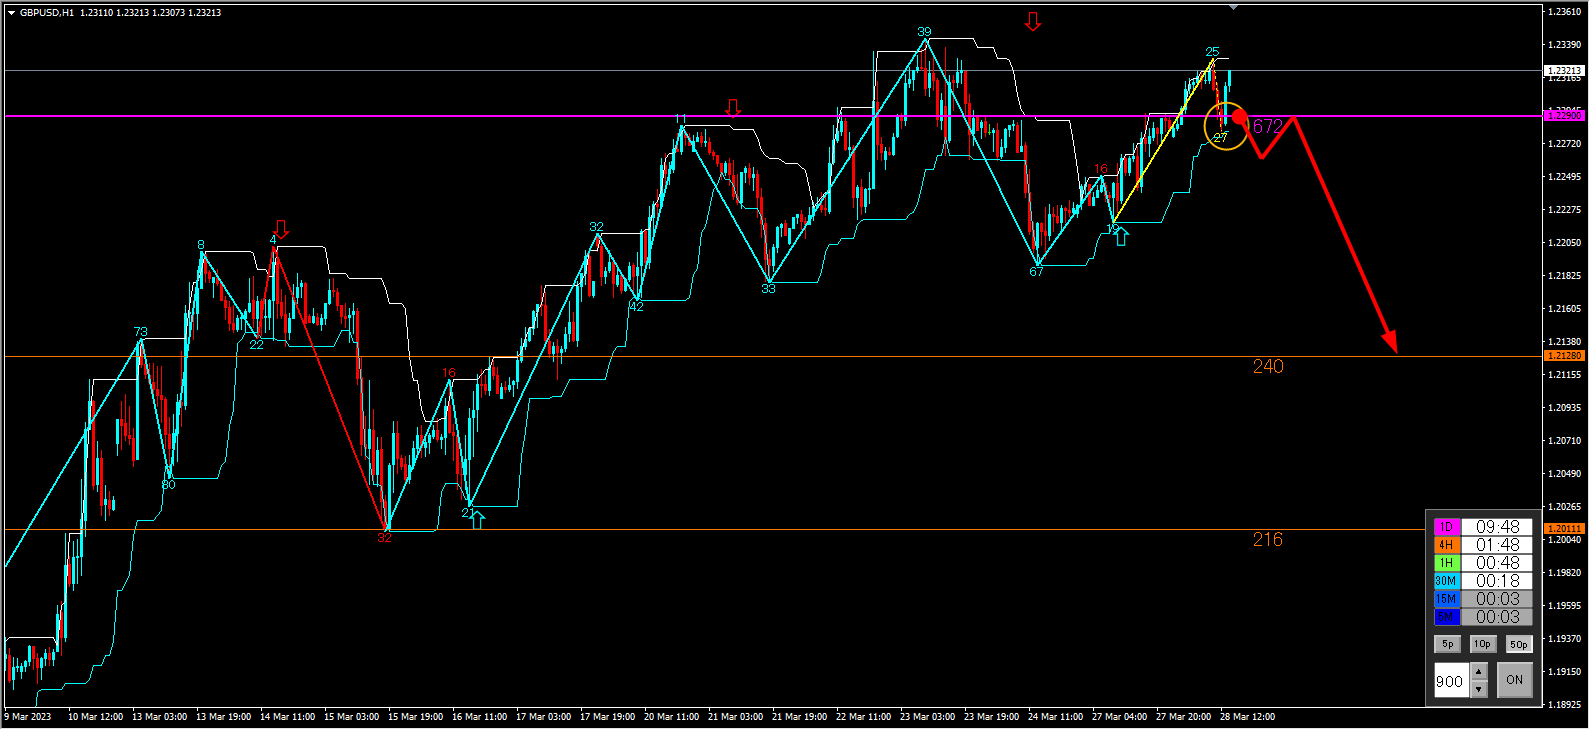
But on the “ROUND UP” the signal for a decline is shown as in the figure below.
If the price action breaks above the body of the candle above the SL line, there is no entry; if there is a clear upward momentum, eye long targets up to the next higher line.
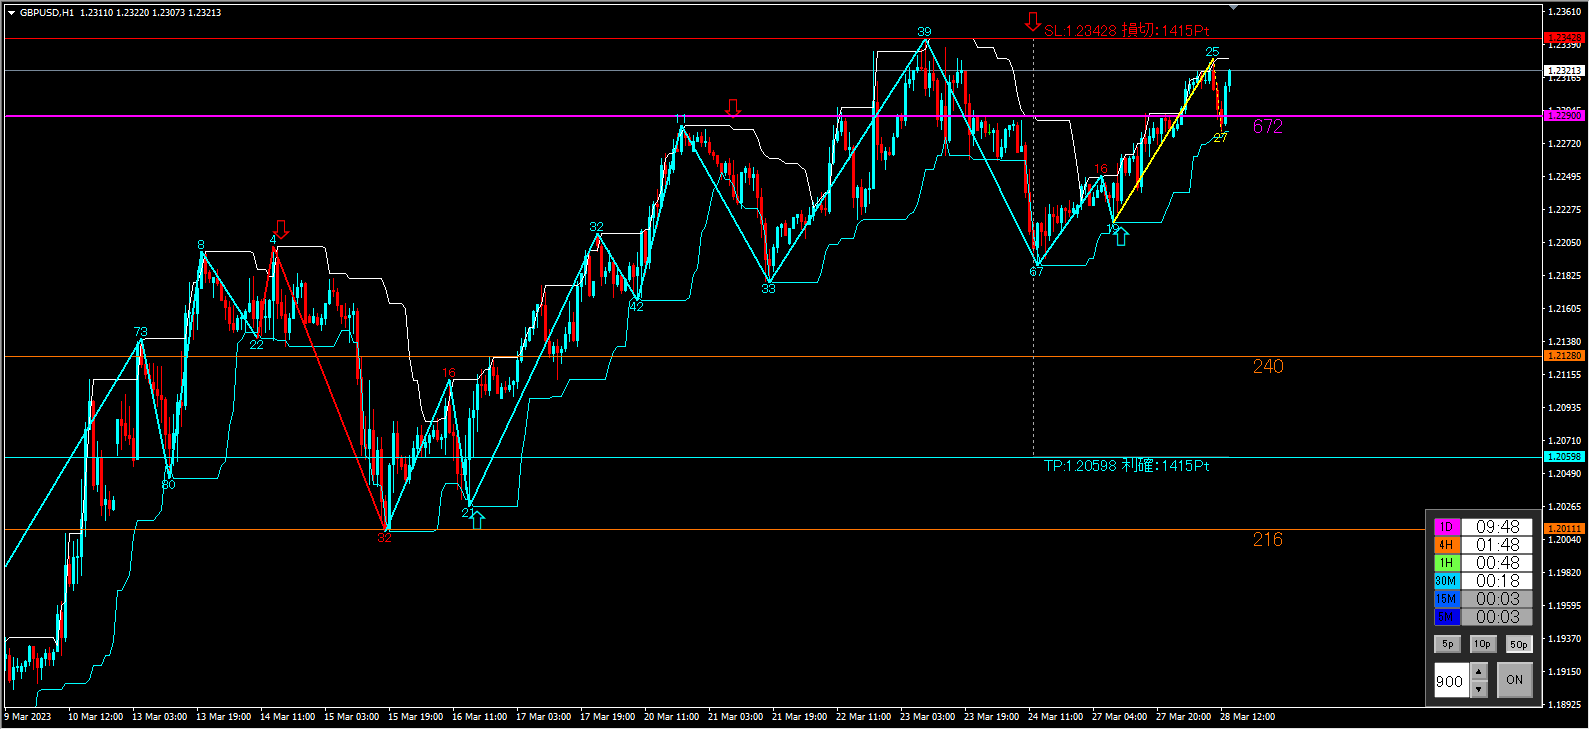
1-Hour Chart
At present, it is forming a rebound and rise off the purple line.
Will the body of the candle break above the recent high and join the upward move, or break below the purple line and create a pullback to join the downward move? That is the turning point.
Either way, I would like to confirm a pullback purchase or a retracement sell on a lower time frame to ride the trend.
In the 1-hour chart as well, a “Round UP” signal for a decline.