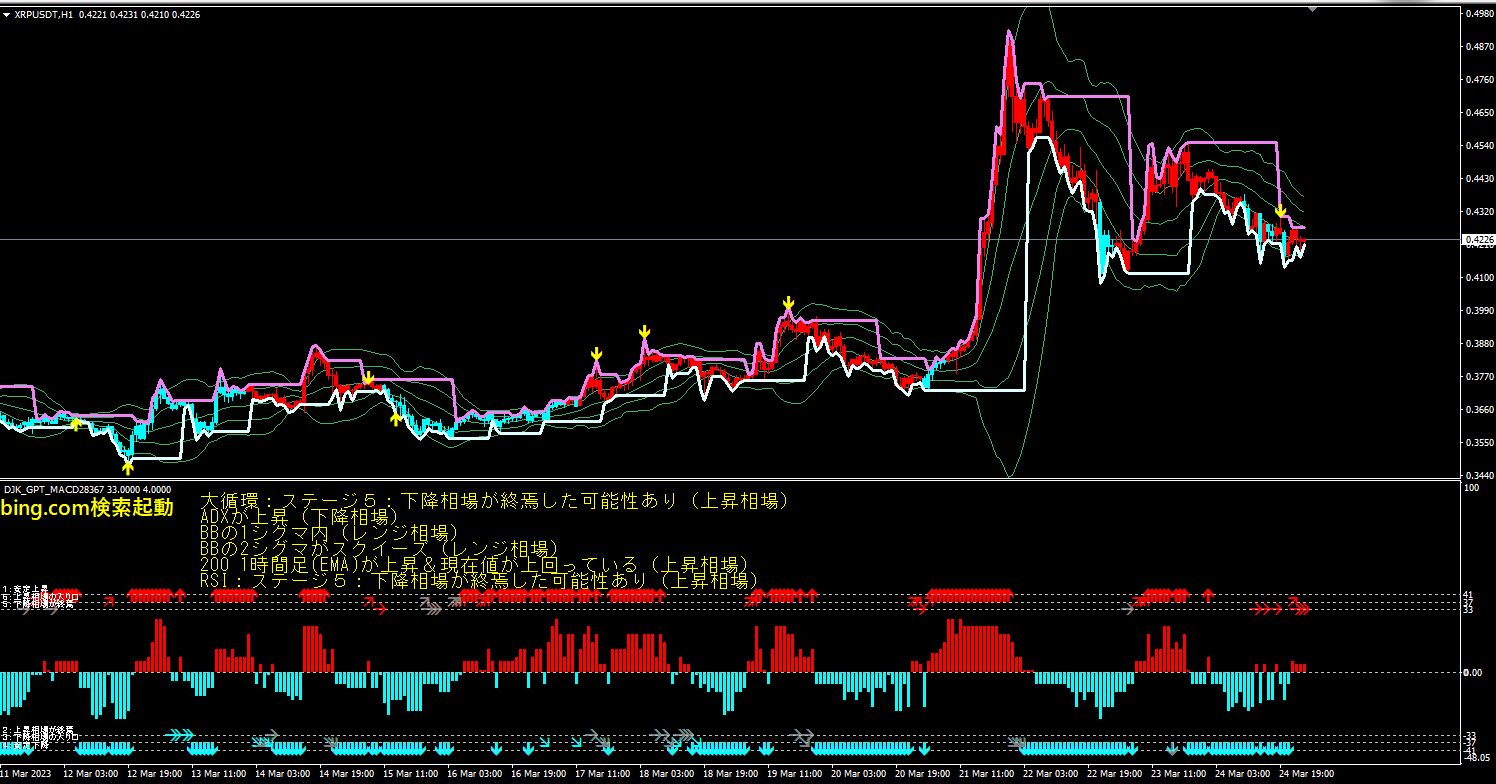
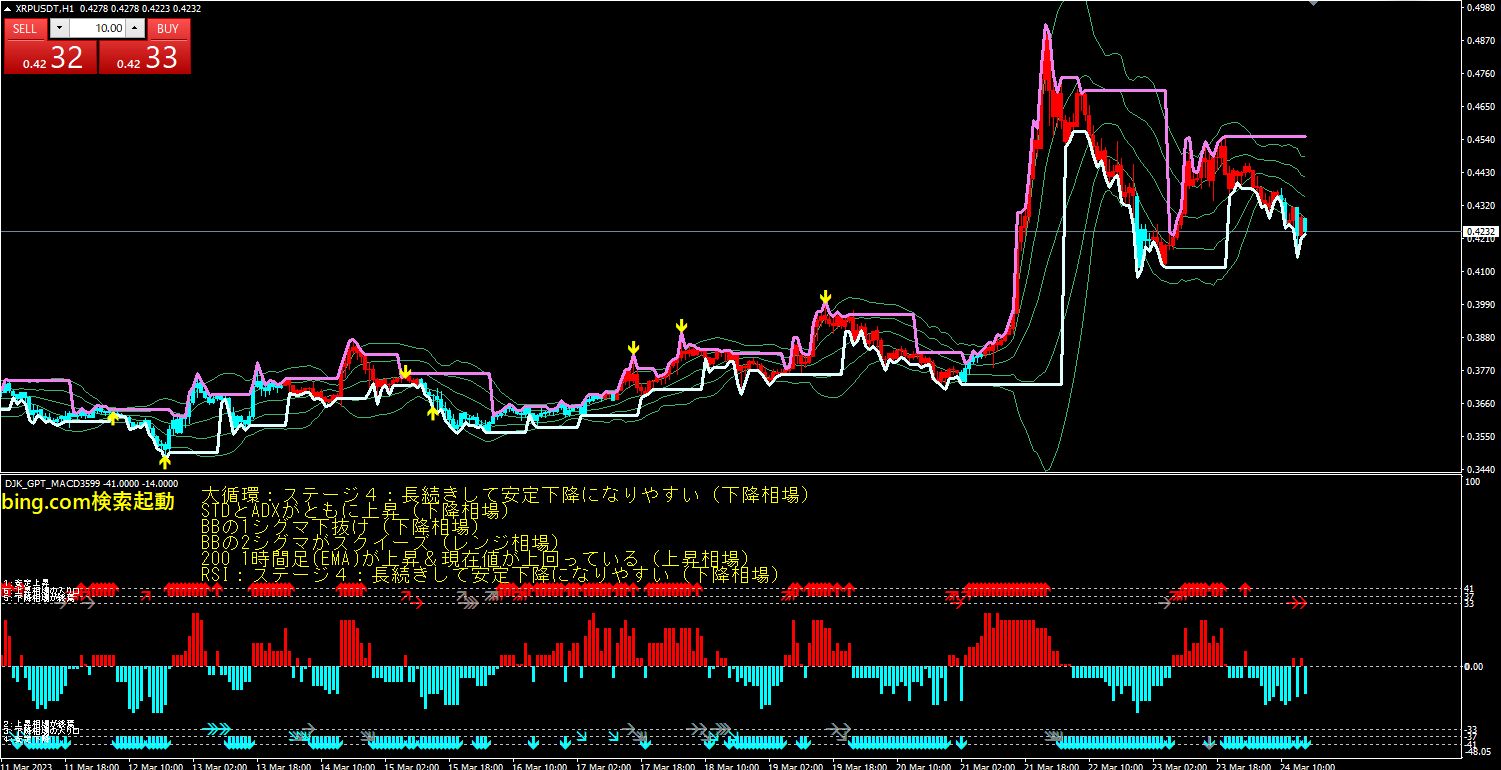
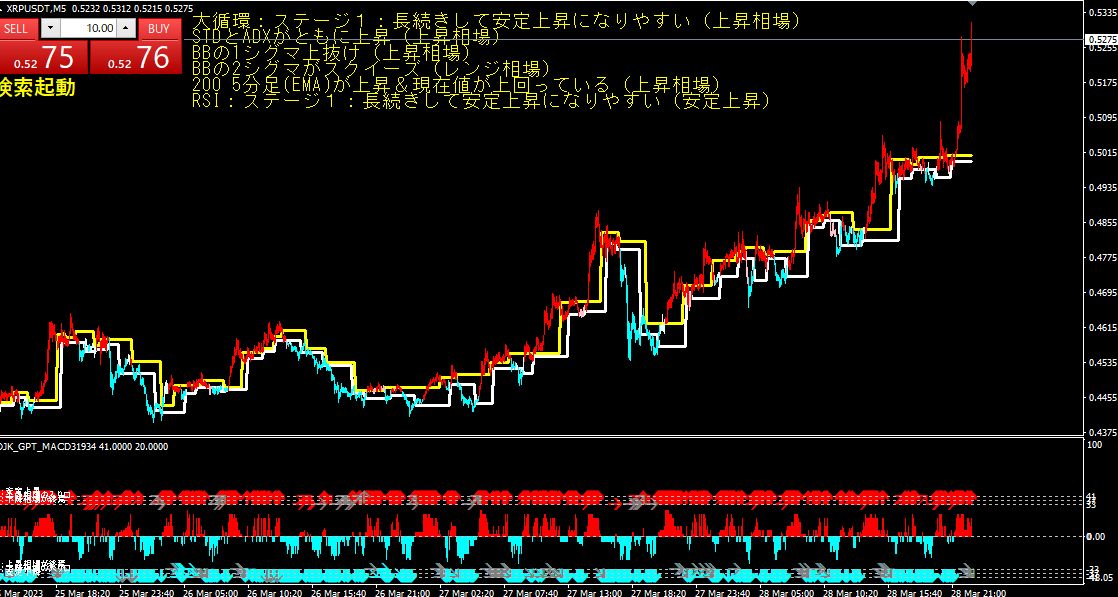
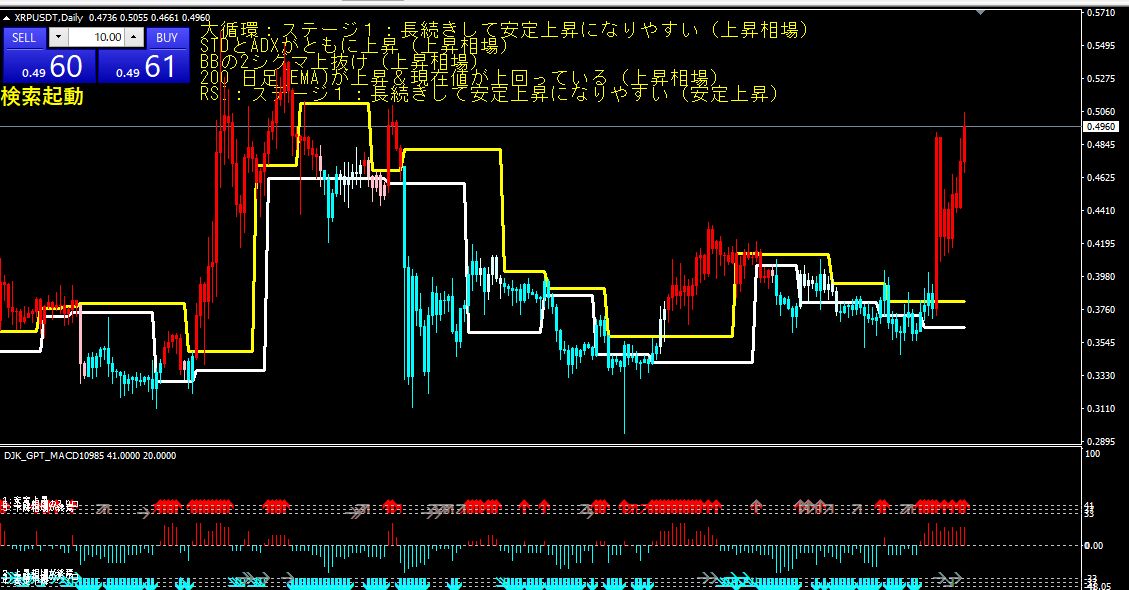
XRPUSDT 1-hour chart March 27 13:56 Buy
Buy
- ADX is rising (bear market)
- Break above BB 1 standard deviation
- BB 2 standard deviations are in a squeeze
- 200 on 1-hour chart (EMA) is rising and current price is above it
- RSI: Stage 1 tends to persist and rise steadily
- Grand cycle: Stage 1 tends to persist and rise steadily
From these conditions, to make a concise trading judgment, the current moment can be regarded as a buy timing.⁴
ADX indicates a bear market, but breaking above BB 1 standard deviation and BB 2 standard deviations squeeze are
signs of a strong upward trend.
Additionally, the 200 on 1-hour chart (EMA) is rising and the current price is above it. This is a bullish signal.
RSI and the grand cycle are both in Stage 1. This is a state likely to persist and rise steadily.
× ![]()