Nikkei 225 1-hour chart March 27 13:41 Buy
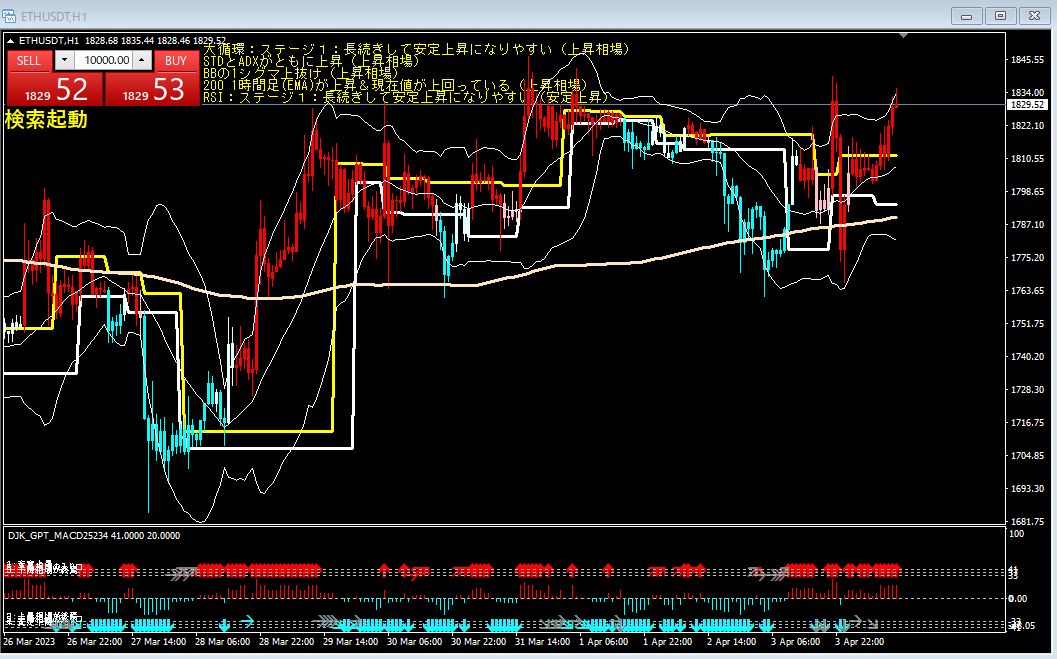
Uptrend
Since the standard deviation range and the ADX are both rising, this is a sign that the market has strong momentum.
Because the price moves above the BB 1-sigma and the BB 1-sigma is expanding, volatility is high, and
there is a possibility that the market may change rapidly.
With the 200-hour EMA rising and the current price above it, it can be regarded as a mid- to long-term uptrend.
There is an upward trend in the medium to long term.
RSI and the stage 1 of the major cycle indicate that a stable rise tends to persist for a long time.
As a result, it can be judged that we are in an uptrend, but due to high volatility, there is a need to be cautious of sudden declines.
Caution is required.
× ![]()