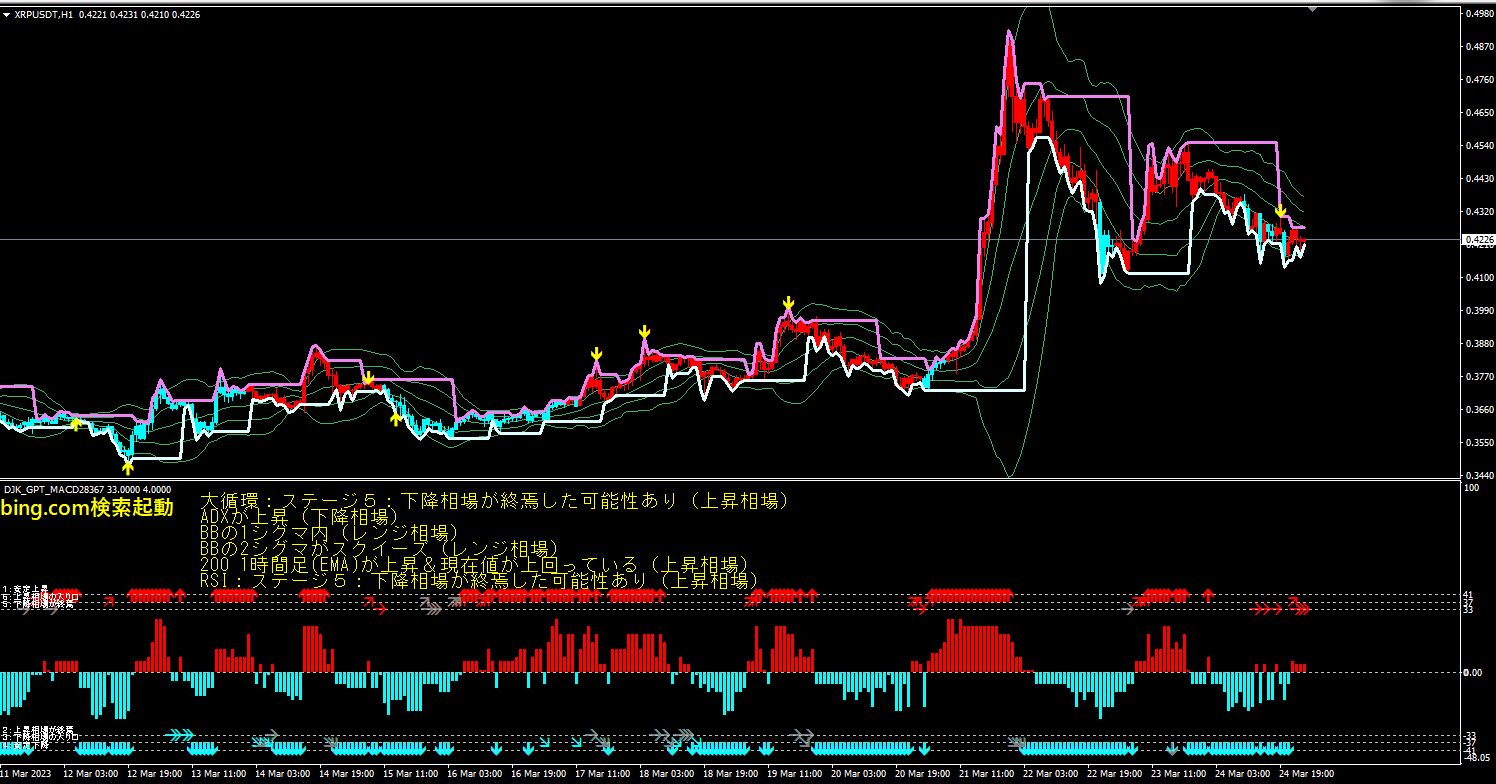
XRPUSDT 1-hour chart March 26 21:16 Range-bound market
It is in a range-bound market and is highly likely at a turning point from an uptrend to a downtrend.
- Standard deviation range and ADX are declining (range-bound market): On the chart, the standard deviation range narrows and the ADX falls. This indicates that prices are moving sideways.
- Within 1 sigma of the BB: On the chart, prices are contained within 1 sigma of the Bollinger Bands. This indicates low price volatility.
- BB 2-sigma is squeezing: On the chart, the 2-sigma band of the Bollinger Bands is narrowing. This indicates decreasing price volatility.
- 200-hour EMA is rising and the current price is above it: On the chart, the 200-hour EMA is curving upward and the current price is above it. This indicates a long- to mid-term uptrend.
- RSI: Stage 3: Entrance to a downtrending market: On the chart, RSI is below 50 and sloping downward. This indicates weakening short-term momentum.
- Long-cycle: Stage 3: Entrance to a downtrending market: On the chart, the cycle indicator has turned red and is sloping downward. This suggests the long-term trend is about to reverse.
Based on the above conditions, XRPUSDT is currently in a range-bound market and is highly likely at a turning point from an uptrend to a downtrend. Therefore, trading decisions are as follows.
- Sell: Enter a short when price breaks below the 1-sigma of the BB or the 200-hour EMA. Take profit near the lower BB bound or around the previous low. Stop loss near the upper BB bound or around the previous high.
- Buy: Enter a long when price rebounds near the lower BB bound or around the previous low. Take profit near the 1-sigma of the BB or near the 200-hour EMA. Stop loss if price breaks below the lower BB bound or the previous low.
× ![]()