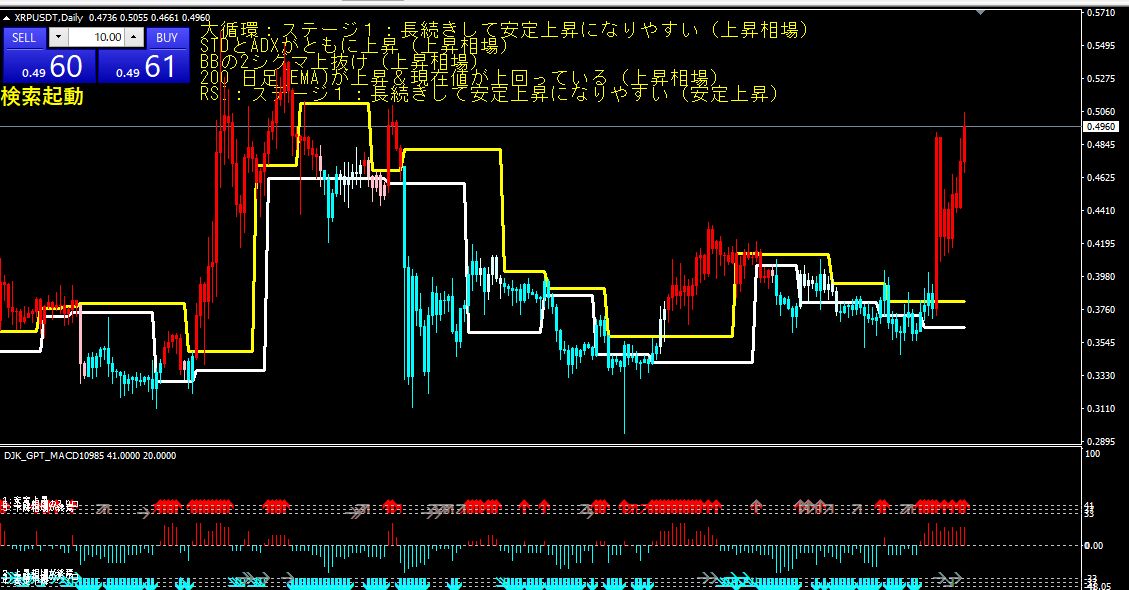
XRPUSDT Daily Chart March 26 Buy
Standard deviation range and ADX are both rising, indicating a bullish trend.
A breakout above 1-sigma of BB (Bollinger Bands) also serves as a buy signal.
A 2-sigma squeeze of BB indicates decreasing volatility and may precede a large move.
A rising 200-day EMA and current price above it indicate a longer-term uptrend.
RSI (Relative Strength Index) is in Stage 1, a condition prone to sustained and stable upward movement.
From the above conditions, XRPUSDT appears to be in a bullish market currently, and holding a long position might be appropriate. However, markets always fluctuate, so please make your own judgment at your own risk.
× ![]()