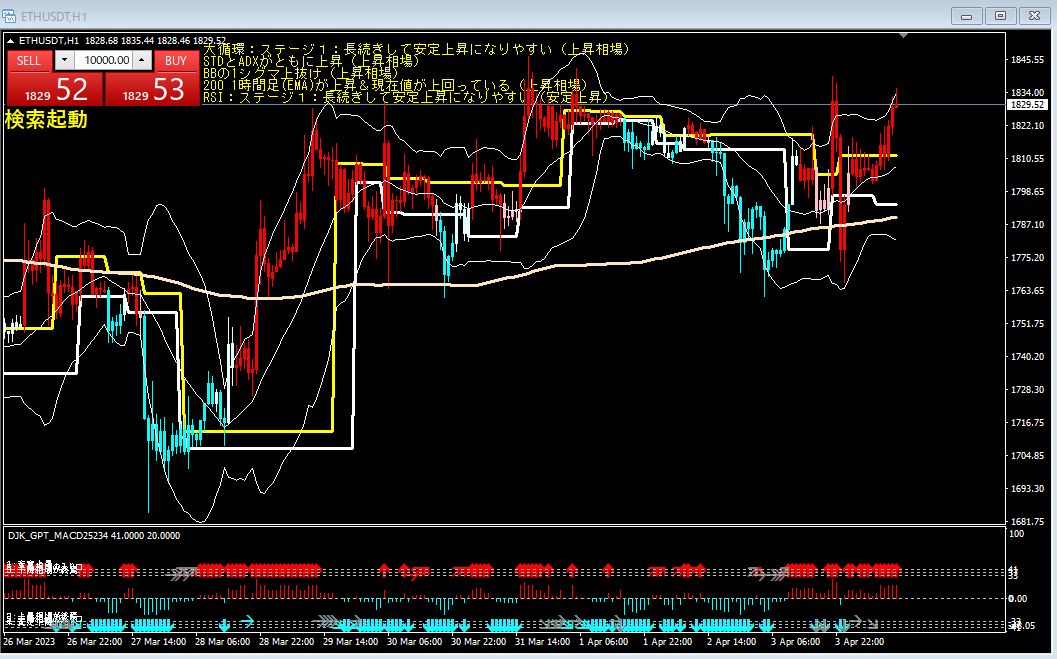
ETHUSDT 1-hour chart March 26 3:08 AM
Strong Sell
- ADX rising (downtrend): Sell signal. Indicates the trend is strengthening.
- Within 1 standard deviation of BB: Sell signal. Indicates low volatility and price near the central line.
- BB 2-sigma squeeze: Sell signal. Indicates extremely low volatility and potential for large move.
- 200 1-hour EMA is descending and currently below price: Sell signal. Indicates a long-term downtrend.
- RSI: Stage 4: tends to stay sustained and decline steadily: Sell signal. Indicates oversold region.
- Grand Cycle: Stage 4: tends to stay sustained and decline steadily: Sell signal. Indicates being in the late phase of a downtrend.
Technical analysis employs various tools and methods, and here we use the following.
ADX (Average Directional Index): An indicator that measures the strength of a trend. Higher ADX means a stronger trend.
BB (Bollinger Bands): An indicator that measures price volatility. BB consists of a central line (moving average) and two outer bands (standard deviations). A narrower BB width indicates lower volatility. Also, if price is outside the bands, it suggests overbought or oversold conditions.
200 1-hour EMA: The 200-hour Exponential Moving Average. Indicates the long-term trend. If price is above EMA, it's considered an uptrend; if below, a downtrend.
RSI (Relative Strength Index): An indicator that measures overbought or oversold conditions. RSI values range from 0 to 100. RSI above 70 indicates overbought, and 30 or below indicates oversold.
Grand Cycle: A pattern representing the four stages of a trend. Stage 1 is accumulation, Stage 2 is uptrend, Stage 3 is distribution, and Stage 4 is downtrend. Each stage has characteristic shapes and movements.
× ![]()