

Utilizing the "Visualization Indicator" (Part 87)
Utilization of the "Visualization Indicator" (its87)
1. Further develop the "28 Currency Pairs List Indicator" into a more advanced indicator
“8 CP Visualization Indicator”CPvisualization indicatorto drawEURAUD.
The “8 CP Visualization Indicator” includesOceaniaversion,Londonversion,New Yorkversion,AnyCPversion. This time, I used theOceaniaversion.
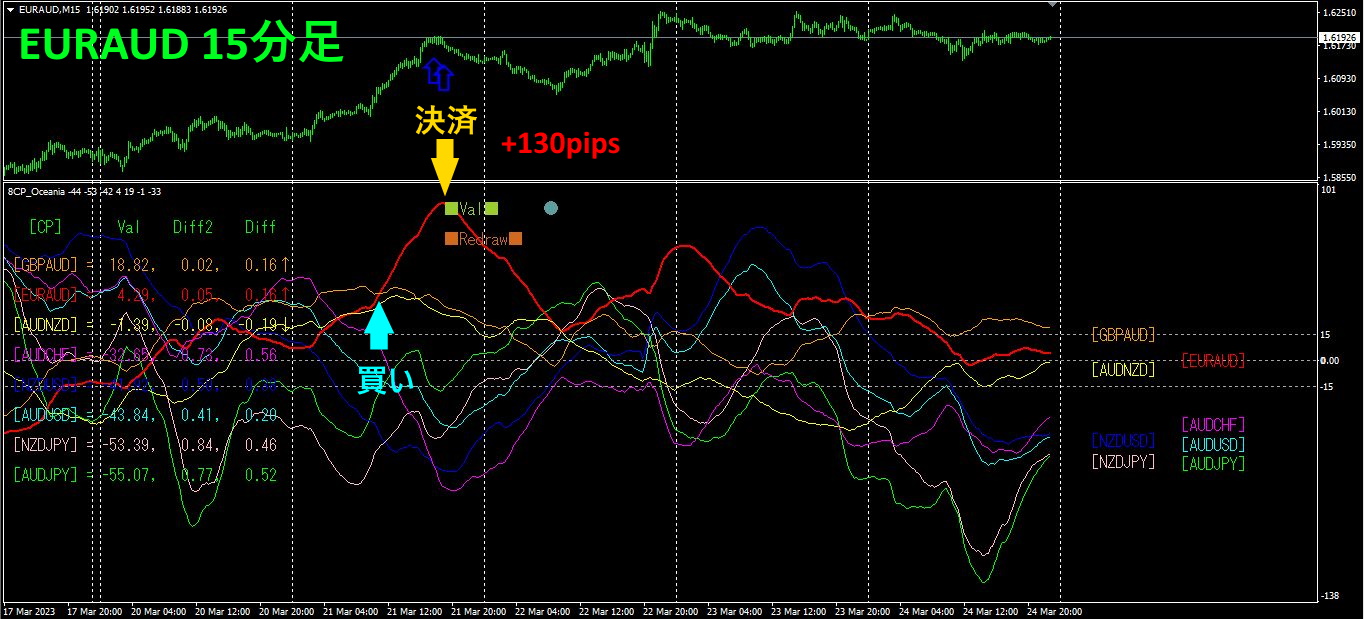
The upper half is the EURAUD 15-minute chart. The arrows in the upper half indicate the alert location of the “28 Currency Pairs List Indicator.” The lower half is from the “8 CP Visualization Indicator.” The red thick-line graph corresponds to EURAUD.
I entered on Tuesday with a short position and closed it the same day, yielding approximately130 pips of profit.
2. Best SelectTry the indicator
The diagram below is a screenshot fromMarch,24,18:53(JST)
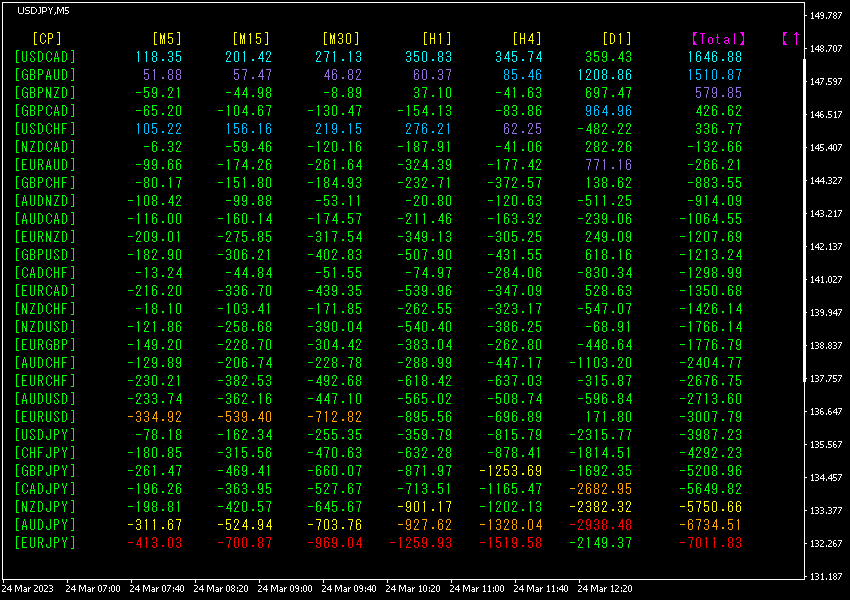
[Total]Sorted in descending numerical order. The bottom rowEURJPYis displayed with all numbers in red except for [D1].Totalshows a value of-7011.83, indicating a large negative number. This suggests a descending trend forEURJPY
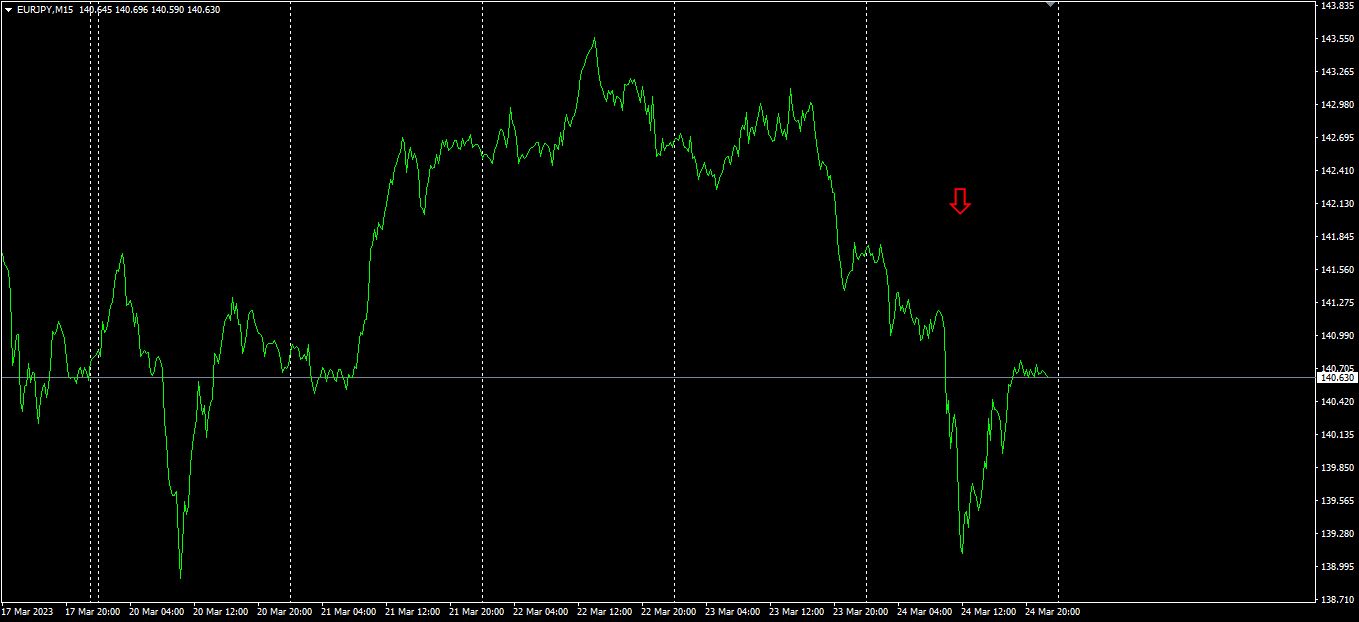
Next, let's look at the EURJPY chart.
Trades are about aiming only for profitable points, avoiding greed, and securing profits reliably. It is also important to refrain from trading during other times.
3. Since May of the year before last, the move of EURJPYhas been tracked. What happened?
Since May2021,EURJPY
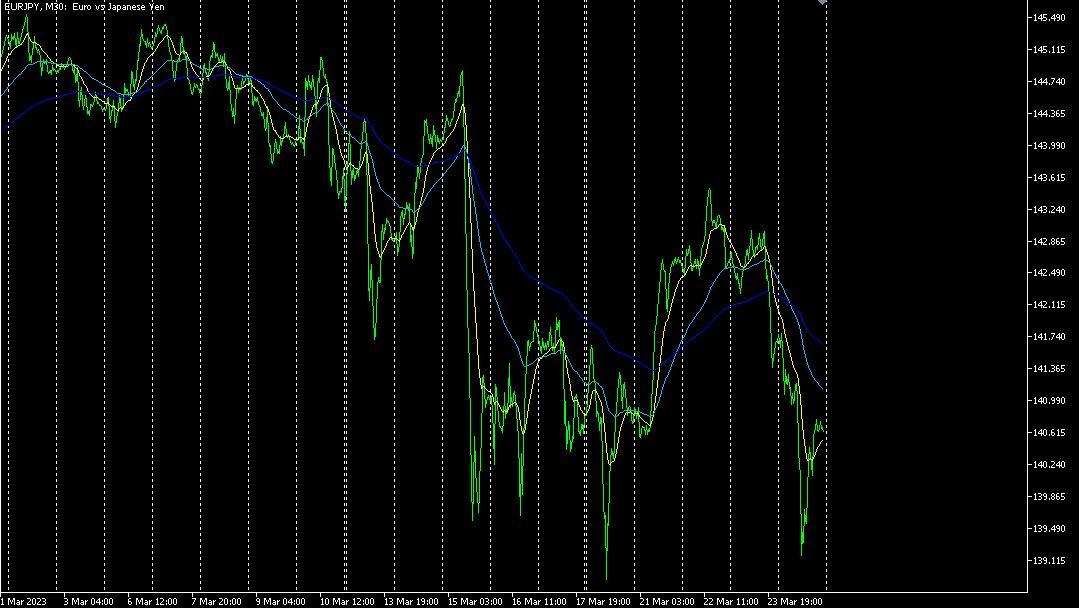
To view the overall trend, I have drawn about30 minutes of the most recent about3 weeks.
Last time I wrote the following.
EURis downward,JPYis significantly upward. As a result,is expected to move lower..
As expected, it moved down significantly.
4Timeframe currency strength chart.
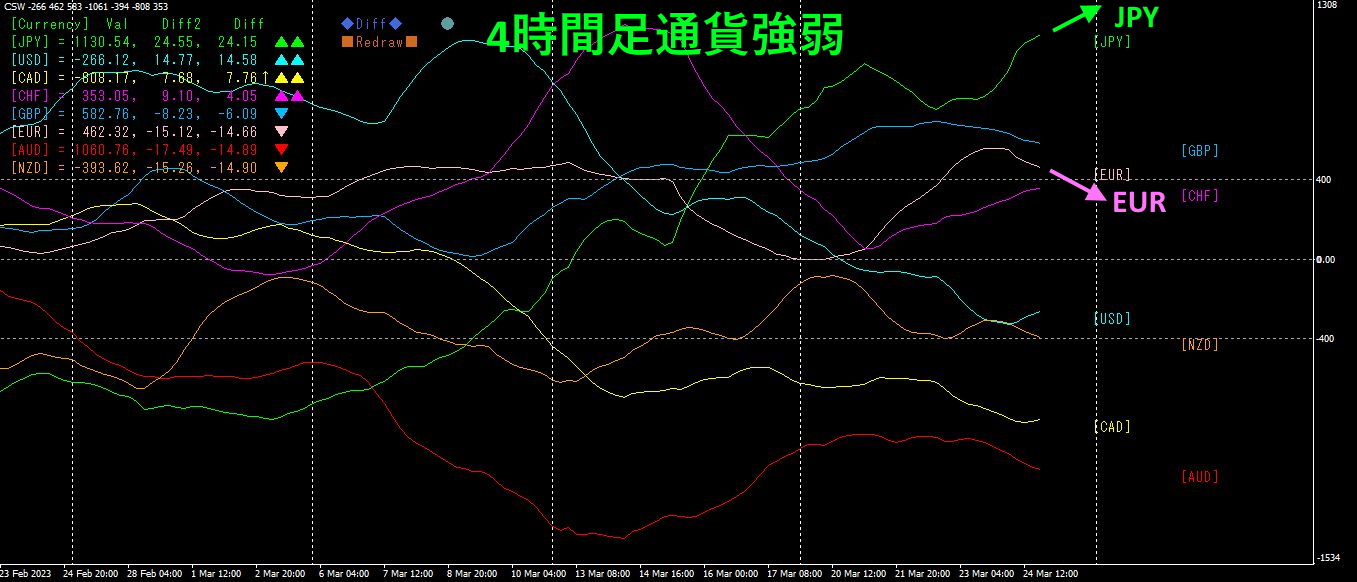
Pink isEUR, green isJPY.EURis downward,is upward. If this trend continues,is expected to move lower.
4. Find tops and bottoms across all currencies and develop a trend strategy
Within the “Visualization Indicator” series there is the “Tangent (Tangent) Search Indicator.” Using this, you can easily identify which currency pairs are at the tops or bottoms among the 28 currency pairs.
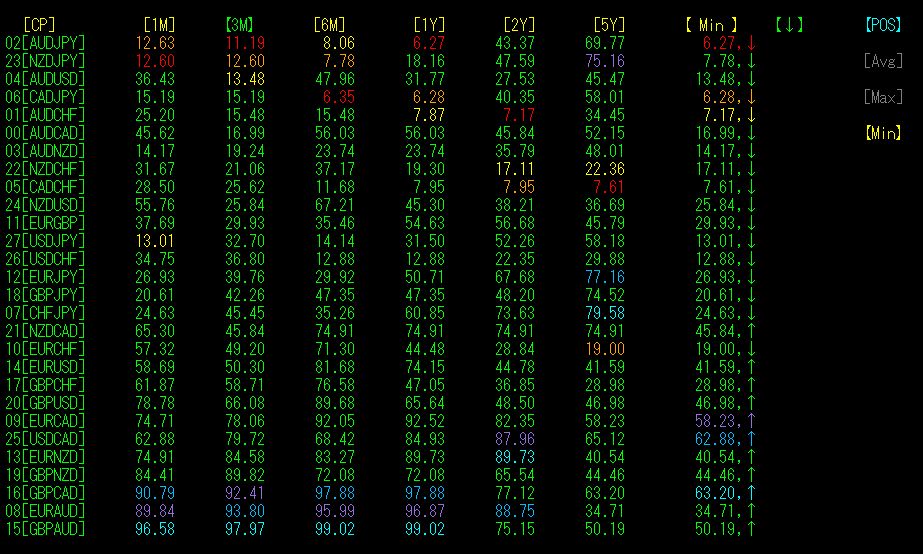
The diagram above shows the “Tangent Search Indicator,” sorted by relative bottom position in ascending order. The top row’sAUDJPYis in the past3 months([3M]11.19), and for the past1 year ([1Y]6.27) the numbers are red, indicating that among 28 currency pairs, it is relatively at the lowest position. However, the arrow shows, meaning the downtrend is still continuing.
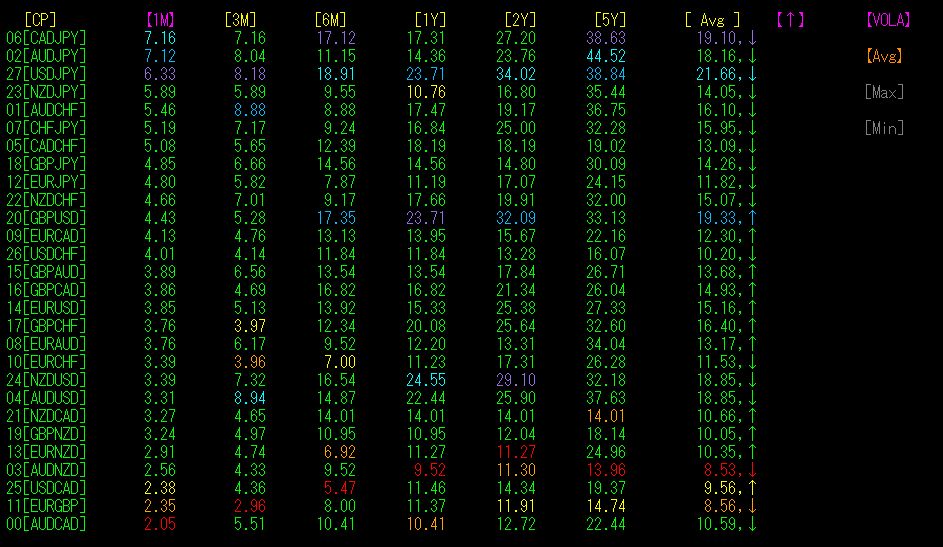
The diagram above is sorted by the magnitude of relative fluctuation.
Period1 month, CADJPY has the largest volatility among currency pairs, while the second-largest is AUDJPY.
<Conclusion>
AUDJPYis almost at a bottom.
Yet the downtrend is still ongoing.
Relatively large fluctuation.
Now, let's look at the chart forAUDJPY.
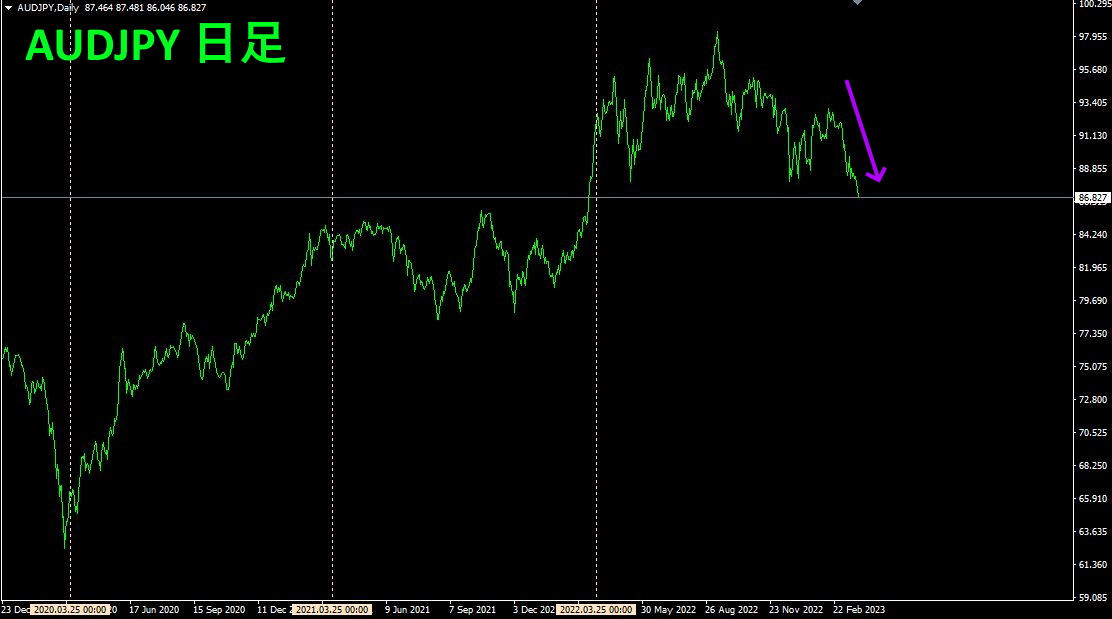
Daily chart.1 year interval vertical dotted lines are drawn. Over the past1 year, AUDJPY is at a bottom, but the downtrend still seems ongoing. The key level around
Next1 hour
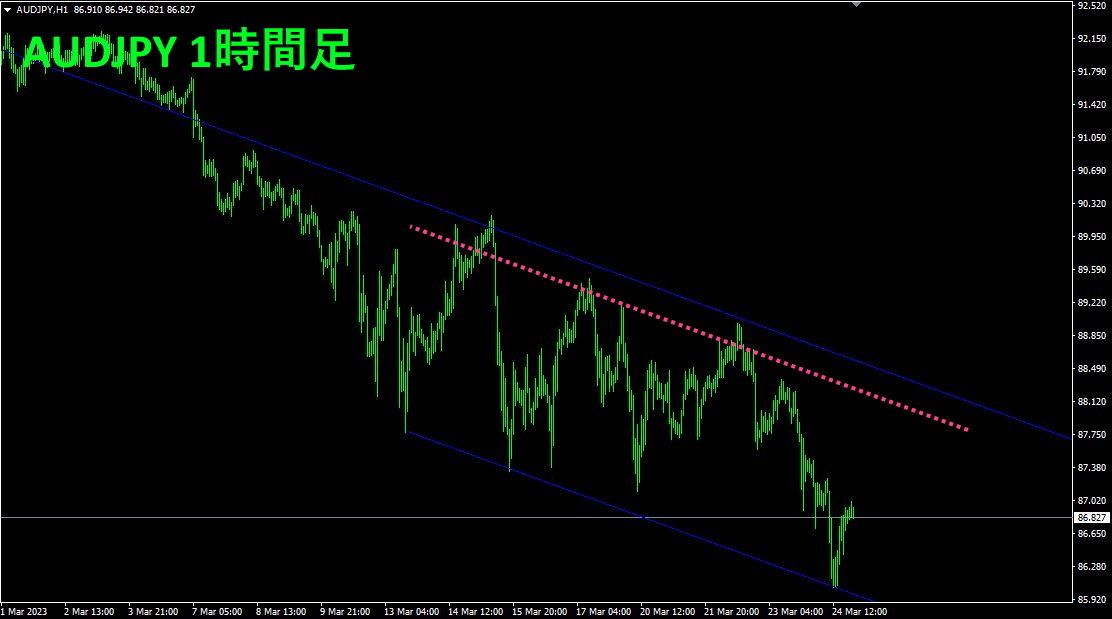
A fairly clean down-channel line has formed.
This would allow semi-automaticEATrend Line EX" to be used for a mean-reversion entry. As shown by the pink dotted line, you can place entry on touch lines and specify the take-profit width from the channel width, enabling easy trading with minimal intervention.
Currently in a downtrend, I will place a sell, but my main aim is a reversal upward with a large number of pips captured in a single move.
By the way, this is premium-level information, isn't it? With about 200 pips of potential profit from the channel width, trading 1 lot would yield about 2,000,000 yen. With this, you can purchase the “Trend Line EX” and still have ample profit (Invest at your own risk).
If you are interested in the “8 Currency Strength Visualization Indicator,” please refer to the following pages.
MT4 version https://www.gogojungle.co.jp/tools/indicators/39150
MT5 version https://www.gogojungle.co.jp/tools/indicators/39159
【My listed products】


