XRPUSDT 1-hour chart March 25 7:33 AM
Buy
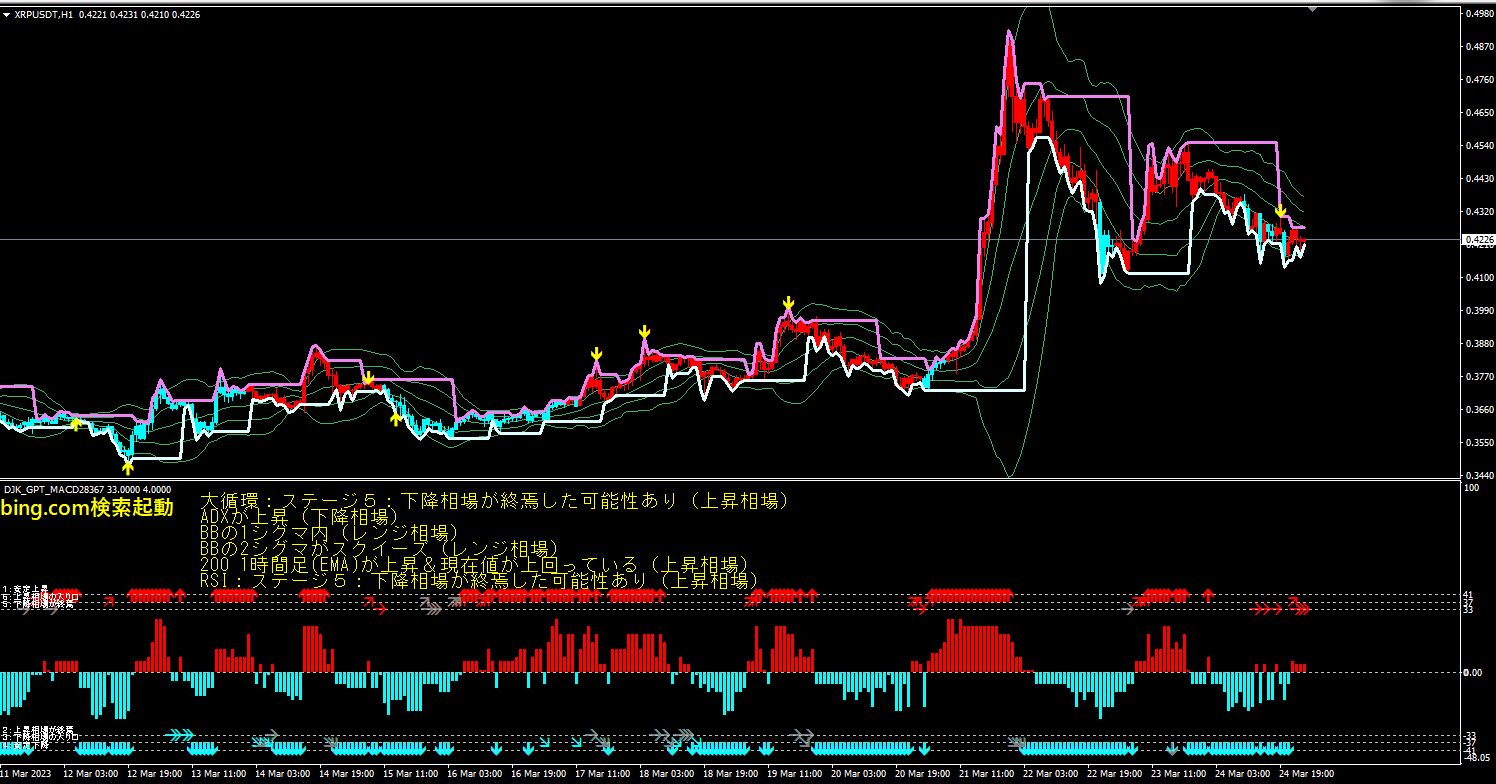
The fact that ADX is rising indicates that the downtrend is strengthening.
However, the BB 2-sigma is squeezing, which suggests low volatility,
and a high likelihood of a directionless range market.
In such cases, the ADX may reflect volatility rather than trend strength.
The price being within the BB 1-sigma indicates that price is
trying to revert toward the Bollinger Band's middle line (moving average).
The moving average can act as support or resistance.
Additionally, the 200-hour EMA is rising, and the current price is above it, indicating a long-term uptrend
In such cases, prices tend to move above the moving average.
Furthermore, RSI and the large cycle being in Stage 5 suggest that the downtrend is nearing its end,
and the potential for a reversal or a rebound is increasing.
RSI is below 25%, indicating an oversold condition.
In such cases, prices may rebound as they become liberated from excessive selling pressure.
× ![]()