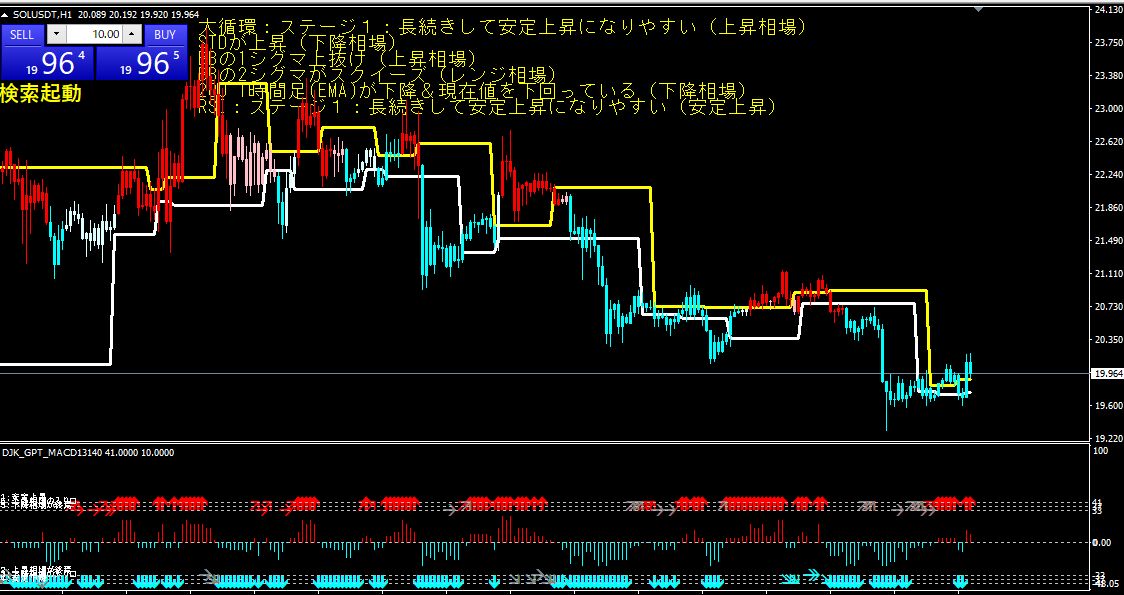
SOLUSD Daily Chart Analysis for Friday, 3/24
Range Market
Because it is within 1 standard deviation of the BB, it can be seen that the price is moving within a certain range.
The 200-day moving average (EMA) is declining and currently below the price, which suggests
that the price is in a downward trend.
The RSI is in Stage 2, suggesting that the upward market may have ended.
The long cycle is also in Stage 2, suggesting that the upward market may have ended².
× ![]()