
FOMC Before FX Trade Strategy: "Genius Move" March 22, 2023 (Thursday)
Hello there!
This is Tatsuron.
Here is the USD/JPY trading strategy!
USD hourly chart
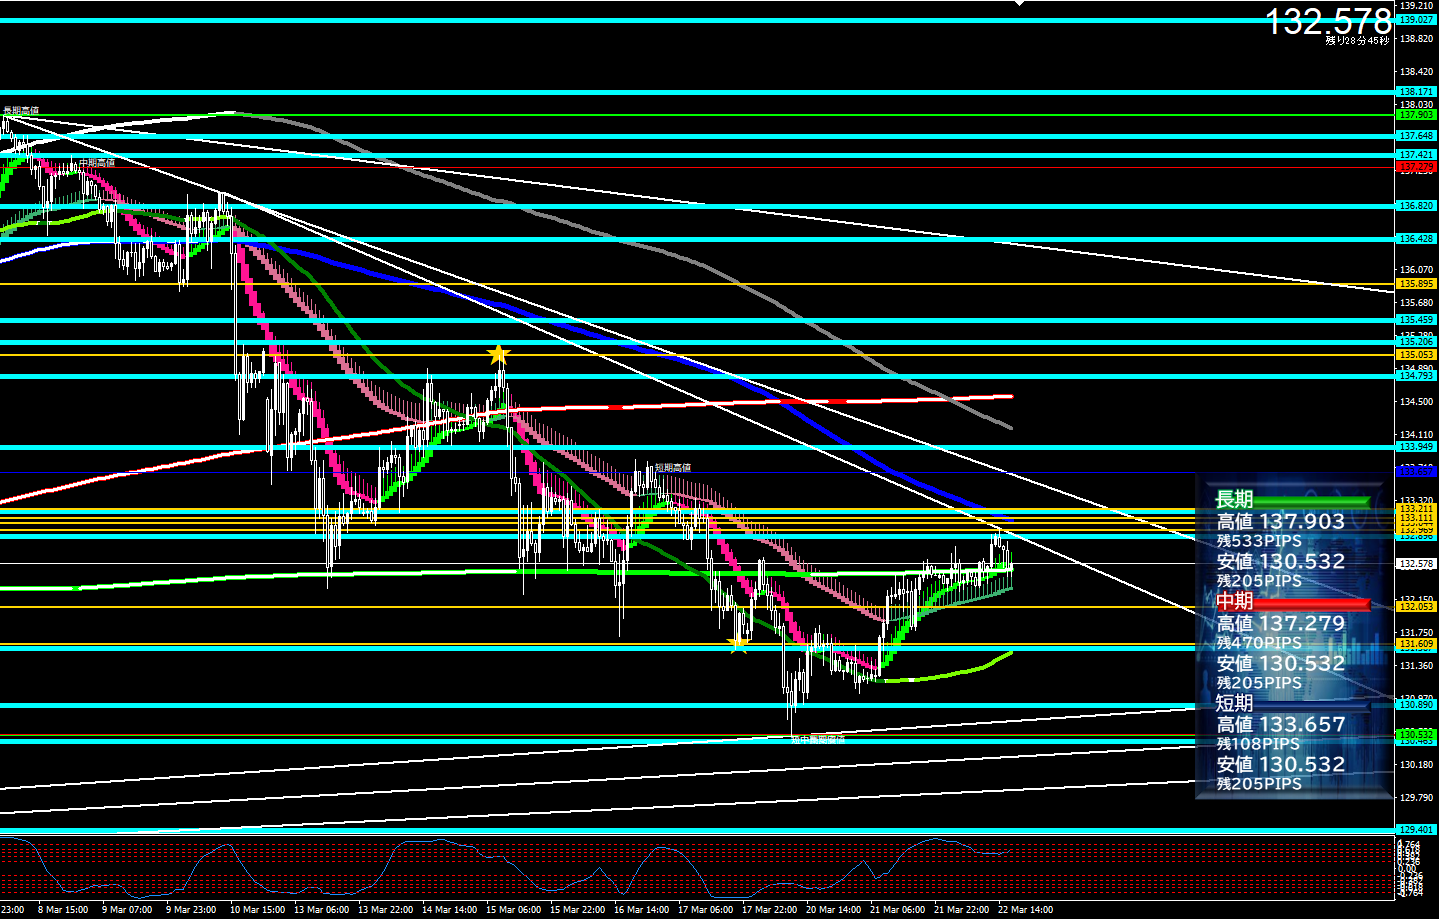
USD/JPY trading strategy
Long points
① 132.896 JPY ~ 133.211 JPYnearby breakout
② around 133.949 JPY breakout
③ 130.463 JPY ~ 130.890 JPYnearby reversal
Breakout strategy
① Near 132.896 JPY ~ 133.211 JPY, a breakout strategy that also involves the downward sloping trend line. Since this becomes the resistance-support conversion zone, as the theory says, go long if it breaks upward, go short if it breaks downward.
② Breakout near 133.949 JPY also carries the expectation of a resistance-support conversion. Use the inner breakout for (1) and add the major trend line for (2).
Reversal strategy
③ 130.463 JPY ~ 130.890 JPY nearby breaks downward, and if it then breaks above this zone from the low 130s or 129s, this becomes a counter-trade opportunity.
Short points
① Around 131.547 JPY breakout
② Around 130.890 JPY breakout
③ 134.793 JPY ~ 135.206 JPY nearby reversal
Breakout strategy
① The 131.547 JPY breakout is a simple new low. If it breaks 132.053 JPY, cut. Aim for the 130s.
② The 130.890 JPY breakout is also a move toward potential new lows. Be cautious of a sharp rise from the 130s due to momentary speed.
Reversal strategy
③134.793 JPY ~ 135.206 JPY near area is where 135 JPY becomes a clear resistance-support turning point.
Even though the breakdown of the downward trend line was a fake or you touched 135.459 JPY but returned, the downside counter-trade potential remains high.
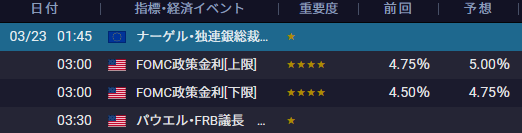
Today’s indicators