Today's Scenario USD/JPY
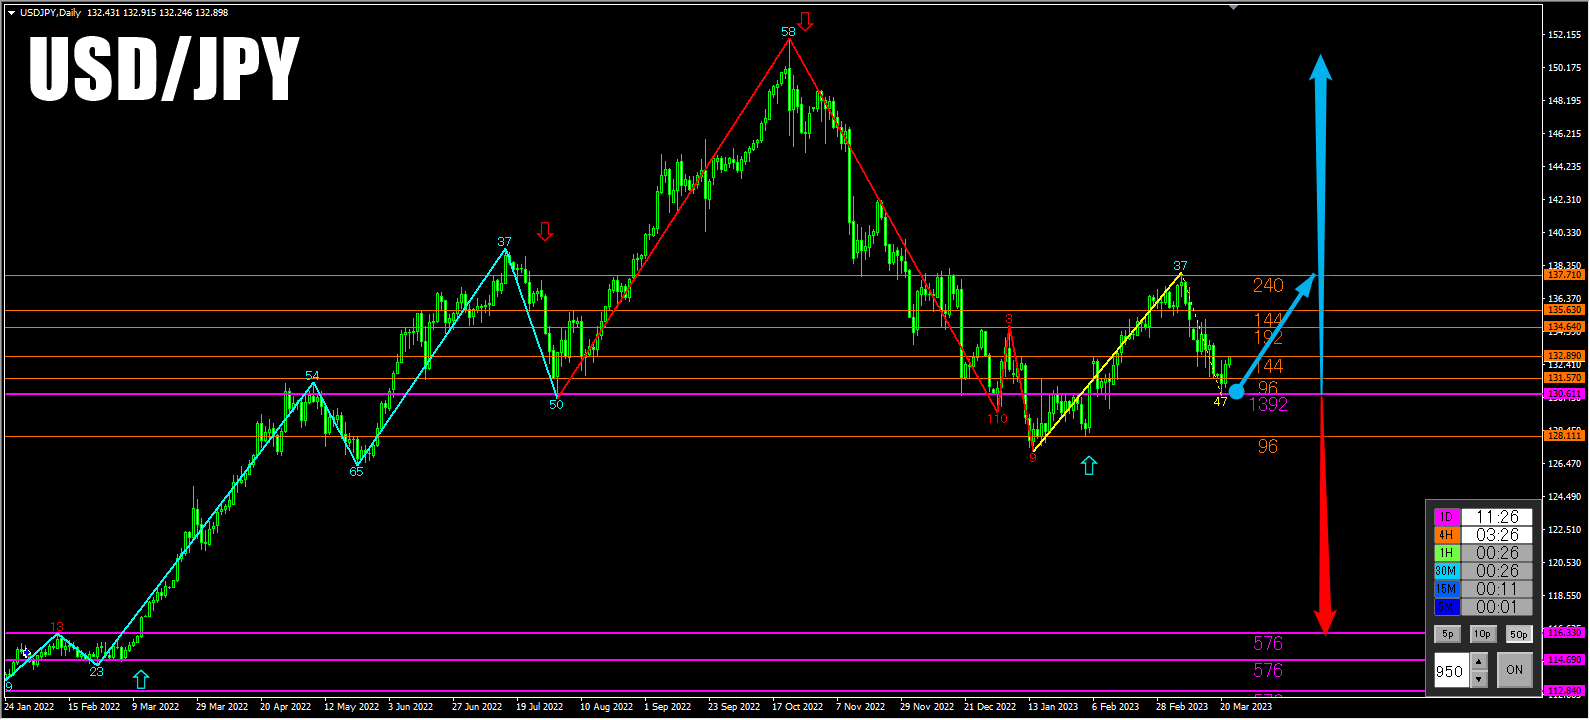
USD/JPY Daily Chart
There is a signal of upward movement as it rebounds from the purple line (1392) that is watched on the daily chart.
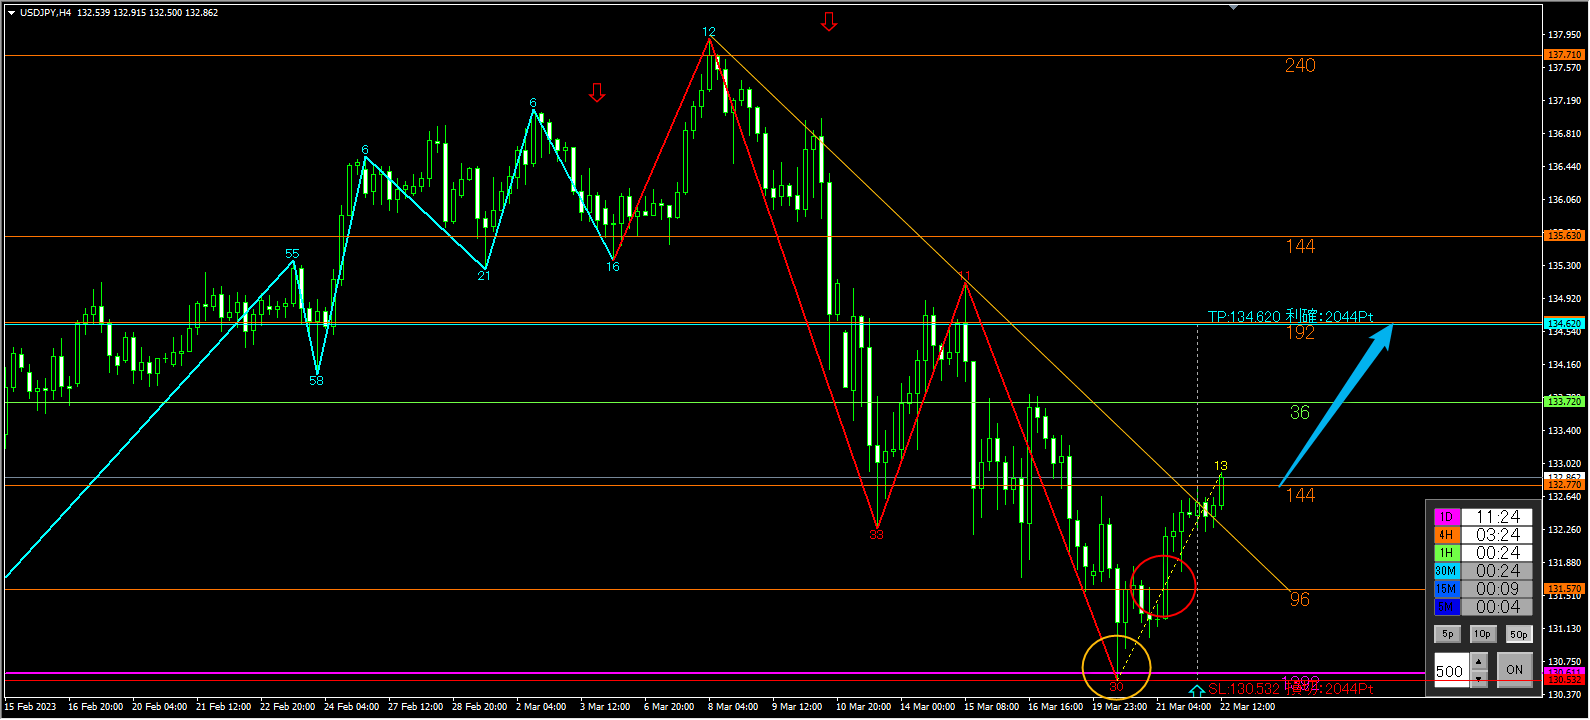
Four-hour chart
Rebound from the purple line (1392) watched on the daily chart, and if it breaks through the orange line (144) watched on the four-hour chart, the momentum to rise may build.
If it clearly breaks the (144) line, I will consider entries with a bullish outlook up to around the orange line (192).
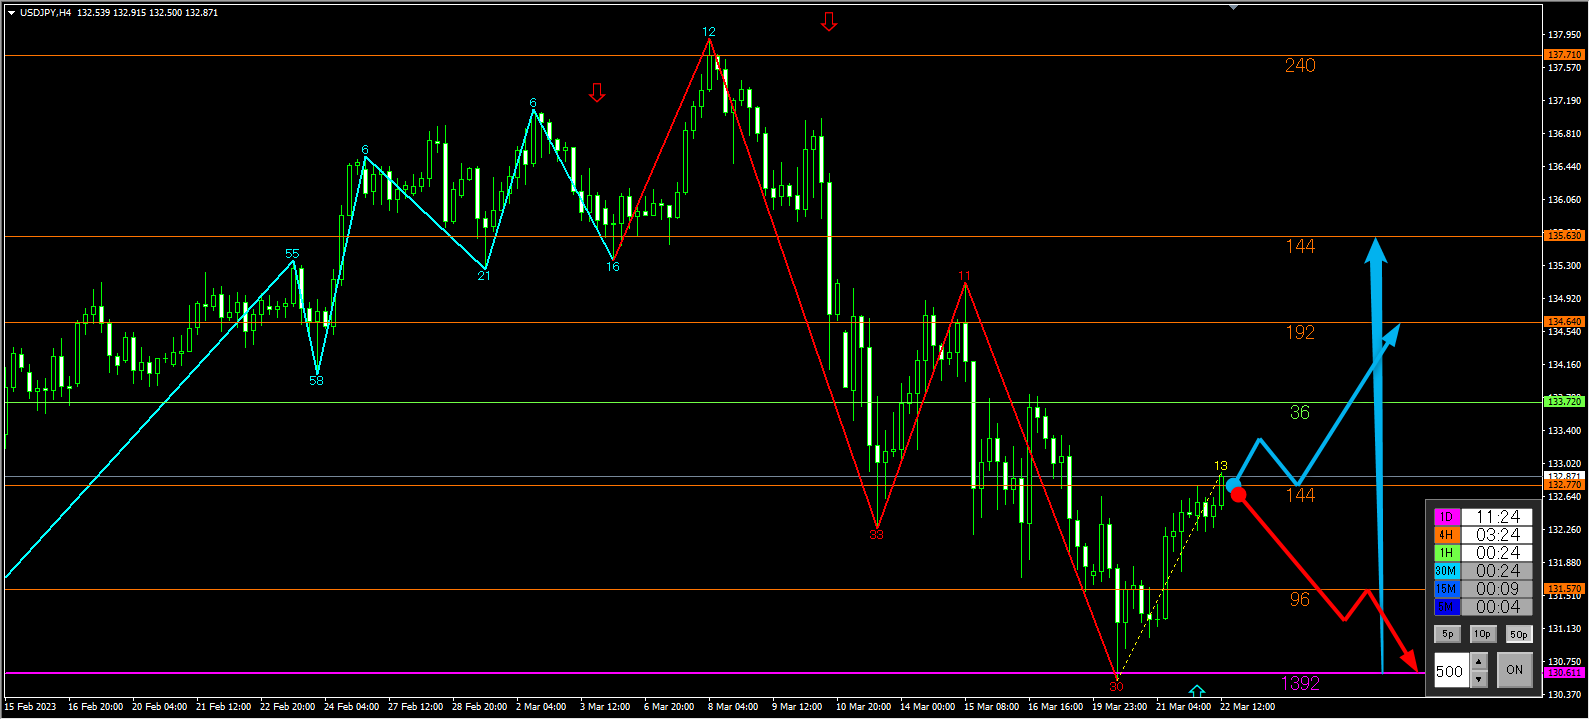
Also on the four-hour chart, the "ROUND UP" signal appeared for a 204 PIPS take-profit.
The downward trend line (yellow) is also clearly broken, and the signal is from the purple line (1392) watched on the daily chart near the yellow circle, with SL and a breakout of the orange line (96).
It is a favorable condition, so I am entering with a small lot.
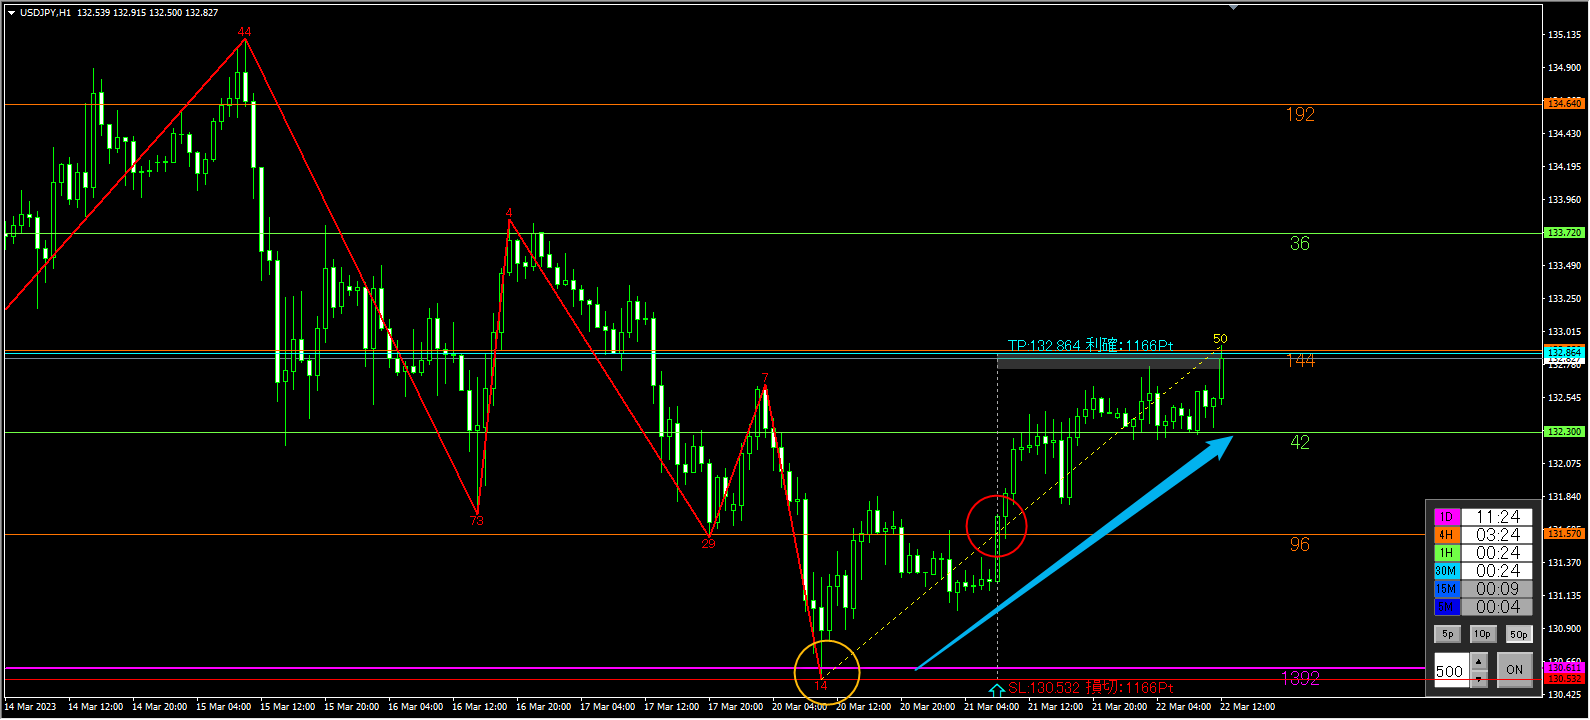
1-hour chart
In the vicinity of the green line (42) watched on the hourly chart, there is a range-like area, which seems likely to break through the orange line (144) watched on the four-hour chart.
It seems good to trigger entry when this line is broken on the hourly chart or the 15-minute chart.
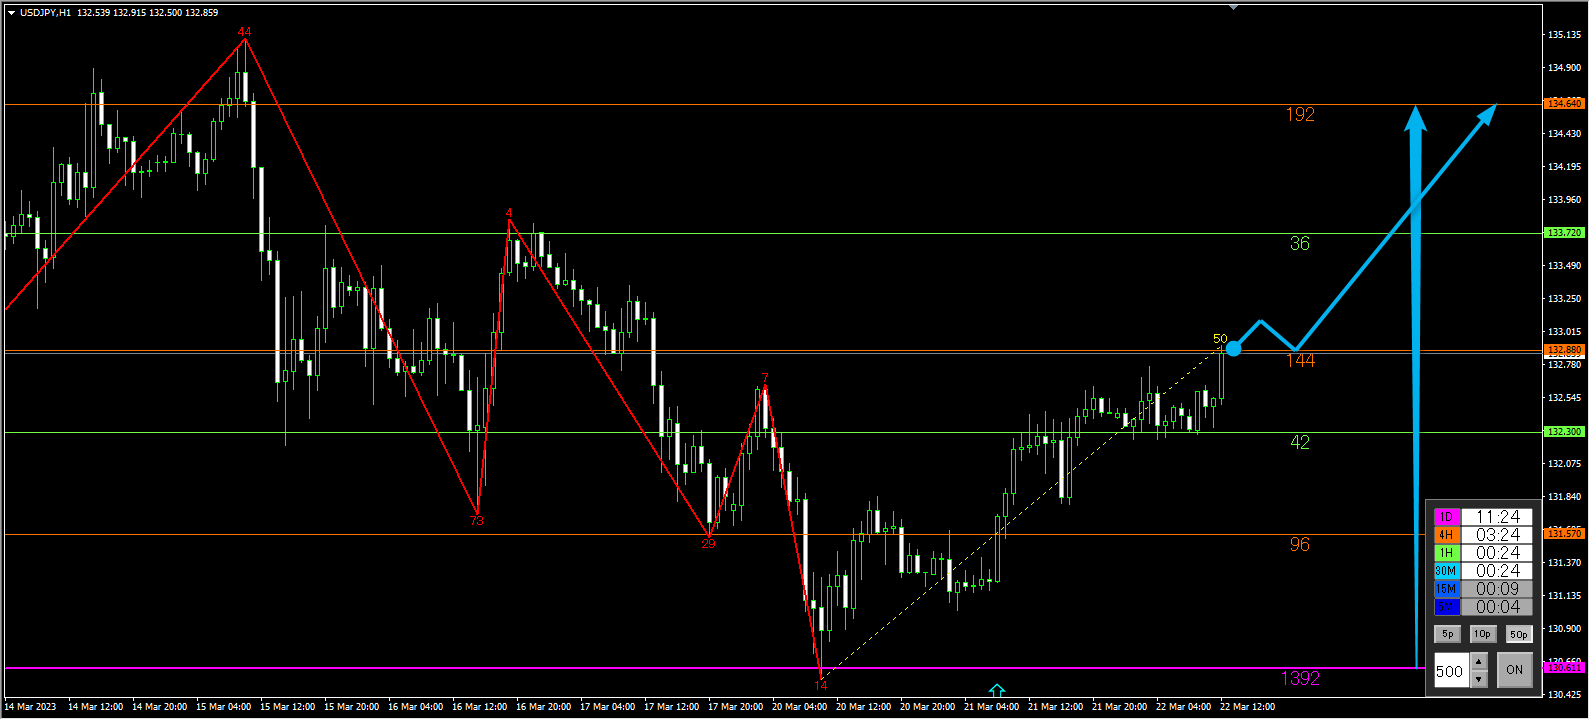
The 1-hour chart also produced a "ROUNDO UP" signal.
Like the four-hour chart, this signal is after breaking the purple daily line and the orange line (96) for the SL point, making it a high-probability signal, allowing an entry and gaining about 116 PIPS.
Recently, the market has shown particularly good compatibility with "ROUND UP" and the win rate is high.