3/22 (Wed) Ripple daily chart analysis
■ Question
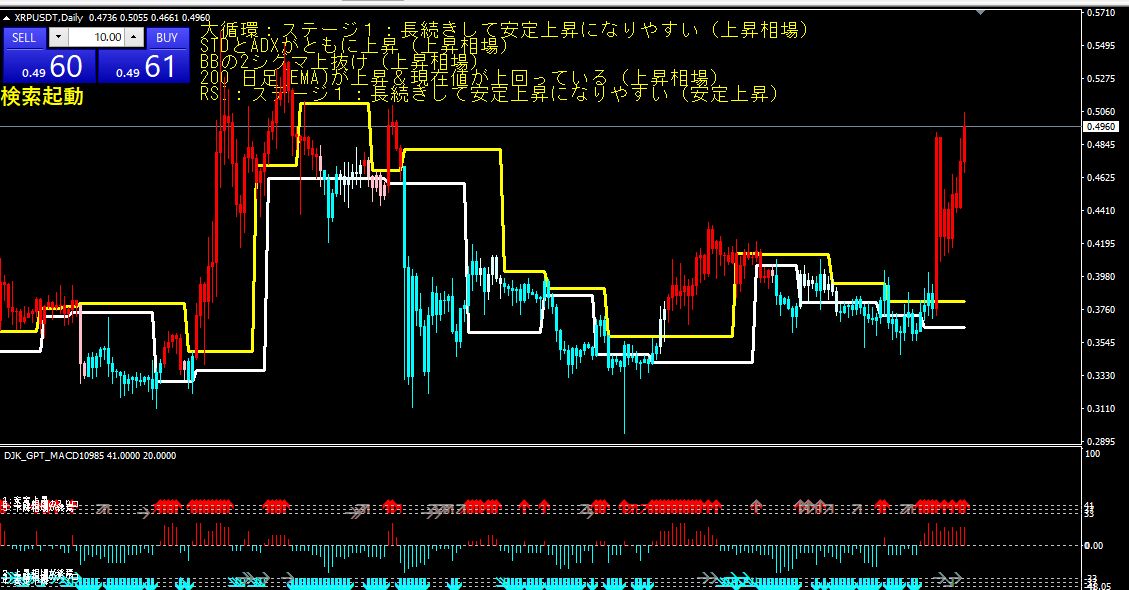
XRPUSDT Daily chart at 19:19 on March 22 describes the following conditions are currently met. Please make a concise buy/sell judgment based on these conditions.
Standard deviation range and ADX both rising (bull market).
BB price break above the 2-sigma line.
BB 1-sigma is expanding.
200-day (EMA) is rising and the current price is above it.
RSI: Stage 1: tends to stay prolonged and rise steadily.
Long-cycle: Stage 1: tends to stay prolonged and rise steadily.
■ Answer
According to the XRPUSDT daily chart at 19:19 on March 22,
standard deviation range and ADX are both rising, indicating a bull market.
The price breaking above the 2-sigma line of the Bollinger Bands and the expansion of the 1-sigma band indicate a buy signal.
The 200-day EMA is rising and the current price is above it, indicating a bullish market.
RSI is in Stage 1, a state prone to prolonged and steady upward movement.
The long-cycle is also Stage 1, a state prone to prolonged and steady upward movement.¹⁷
Based on the above conditions, XRPUSDT shows a buy signal and indicates a bullish market.