

The translated content in English (keeping HTML format) is: Utilization of the "Visualization Indicator" (Part 86)
"Visualization Indicators" utilization (part86)
【Special Edition】"Trend Line EX" How to use (Part 2)
"Trend Line EX" How to use it as a special edition, as part of the "Visualization Indicators" series. This is a continuation from the previous installment.
1. Apply "Trend Line EX" to short-term time frames
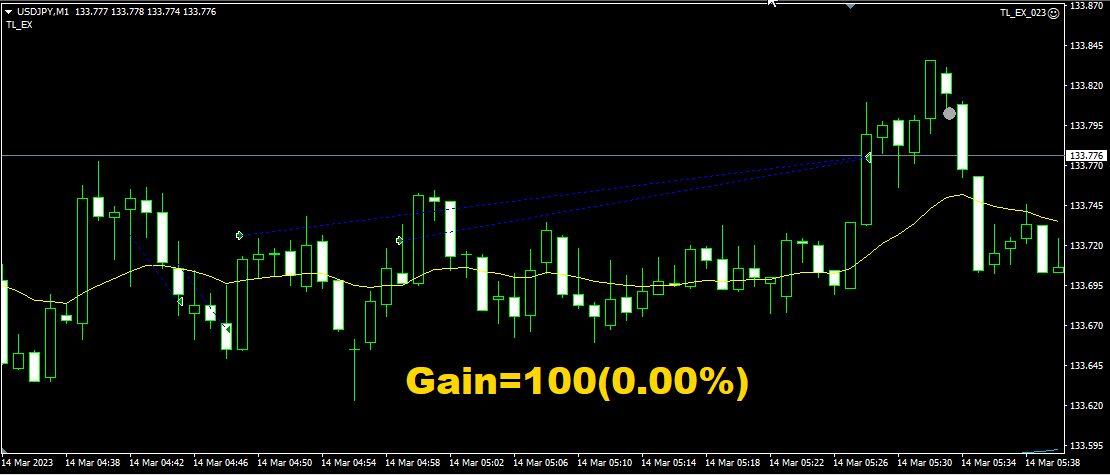
<Case 1>USDJPY 1-minute chart (MT4 to\100ATM?!)
As the split entry feature has been added,1-minute candles can use "Trend Line EX" for short-time frame trading such as scalping.
<Case 2>USDJPY
1-minute chart
Lot size is10 times larger. Profit amount target was also10 times, set to\1,000.
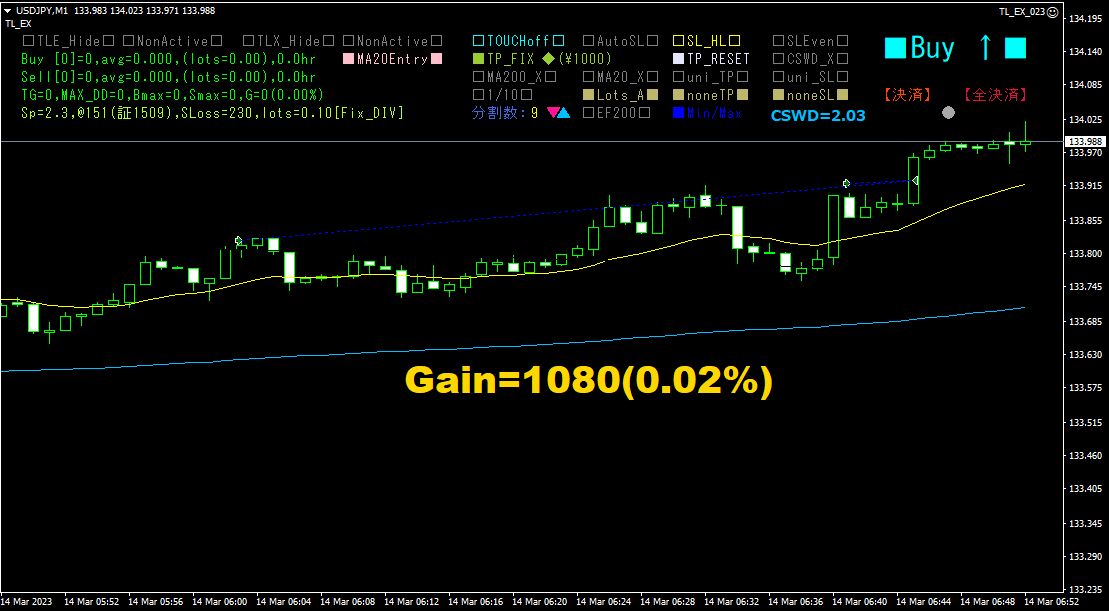
Again, this is the second split-entry.42 minutes to\1,080 profit obtained.
"Wishing to make profits quickly in a short time" is a common dream. However, there is a pitfall. If the market moves against you, what happens? Always consider that there can be losses before gains.
In fact, in the above cases, multi-timeframe analysis on higher timeframes is performed first, then buys on the short-term chart are decided.
Check the direction and position of moving averages. In Case 2, MA200 is rising to the right, MA20 is above MA200, satisfying upward-trend conditions according to Dow Theory. A trend must exist to follow a trend.
<Case 3>USDJPY
1-minute chart
Continuing from Case 1 and Case 2, we continued buying USDJPY on the 1-minute chart. The lot size and profit amount were the same as Case 2: lot0.01, profit target\1,000.
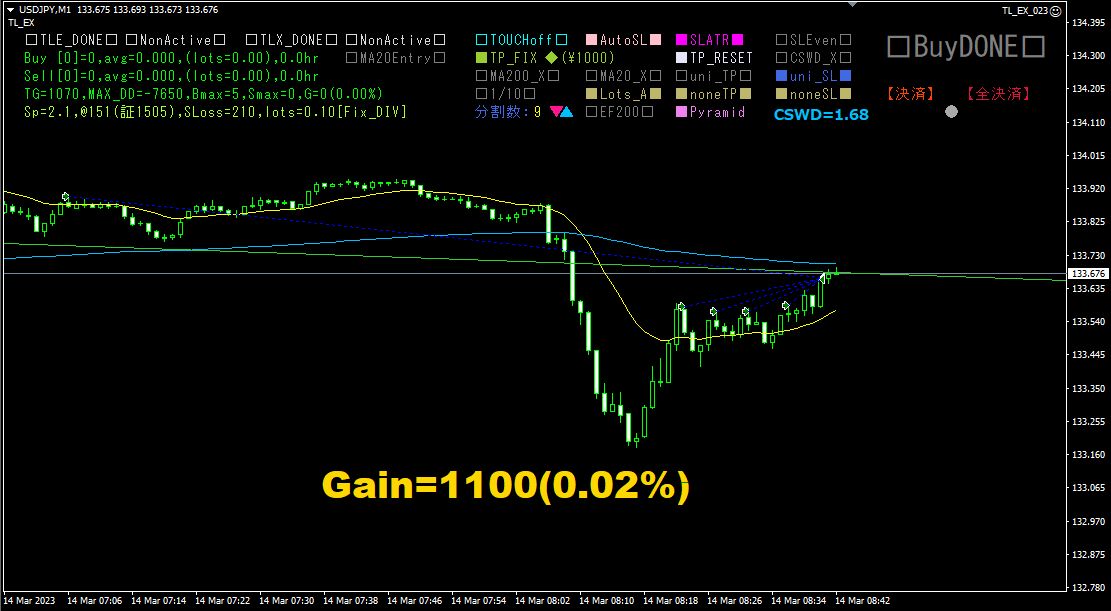
At the first buy, EMA200 was rising, but later turned downward. The rate also dropped sharply. So the method was changed to■Pyramid with the number of splits changed to 9, aiming for early profit-taking. The result was a 6-split entry with the predetermined profit, but the maximum drawdown was. profit therefore had an unfavorable drawdown.-\7,650\1,000EMA200 turned downward, so we decided to stop further trades. Stopping is also an important trading decision.
This time, we tested the split-entry function of "Trend Line EX" in a trial run. In total, we earned\2,280 profit, with a win rate of100%.
<Case 4>NZDJPY5-minute chart, with discretionary position increases
2023 year month316 day afternoon trade. This is a screen copy of the "28" currency pair Best Select indicator around 13:30 Japan time on Thursday.
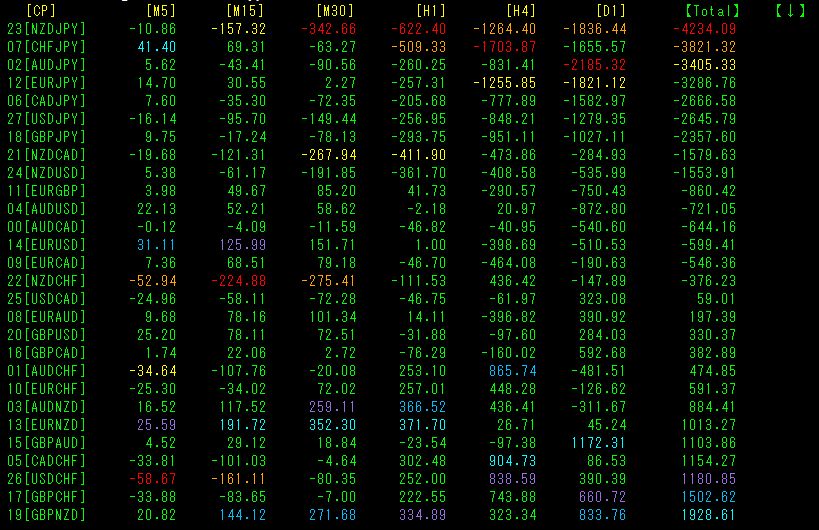
Among all currency pairs, almost no trends. If one must be chosen, it would be the top row's [NZDJPY] sell signal. In any time frame, the numbers are negative and the total value is
However, for short time frames like [M5], [M15], etc., the numbers are small, indicating a weak downward trend.
Trade NZDJPY by selling, and plan a day-trading strategy to “take profits quickly” if any profit is realized.
NZDJPY5-minute chart with "Trend Line EX" inserted, starting trading. Lot size is Auto, split-entry count specified as 4. Set the trendline (TLE) for entries.
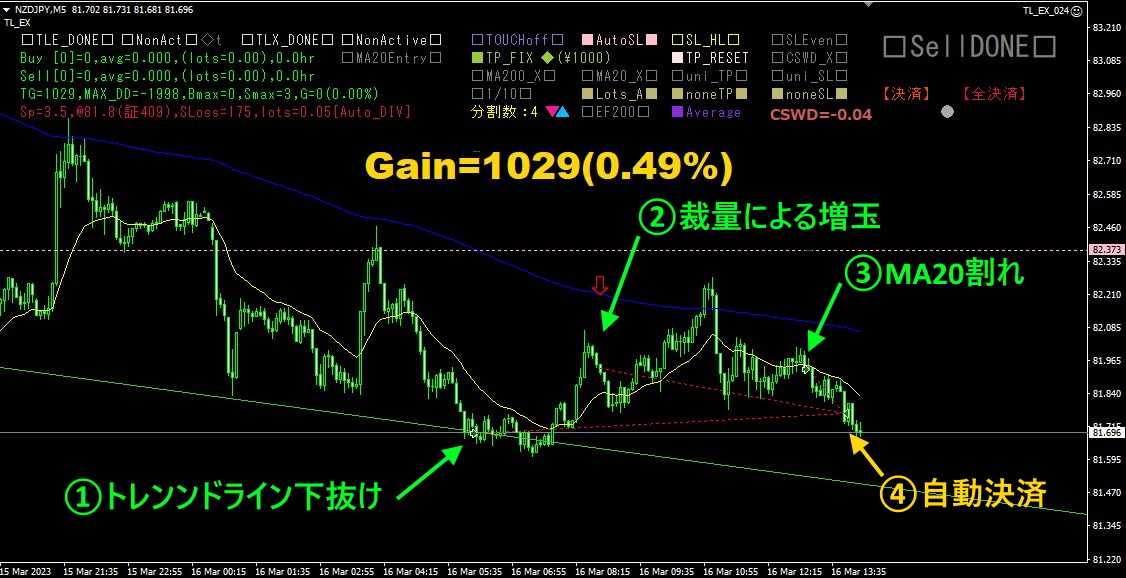
First auto-entry occurred when the trendline broke downward. ①
Later, the rate did not drop much. It seems to be a weak downward trend. After a small drop following a bullish candlestick, discretionary averaging was performed. ②
"Trend Line EX" is a semi-automatic EA, so even while the EA is running, manual averaging is possible.A hybrid of automatic/manual trading is possible with this EA.
breakdown automatically creates the third position. ③
Subsequently, it was automatically closed at the specified profit amount. ④
Originally, we planned for small profit-taking, so this is acceptable. If the position holds too long, we also considered forced liquidation.NZDJPY If there is no profit, cut it early and switch to other currency pairs with trends to utilize funds efficiently.
So far, total profit is\3,309 (win rate100%).
<Case 5>NZDUSD
5-minute chart
As before, refer to the "28" currency pair Best Select indicator.
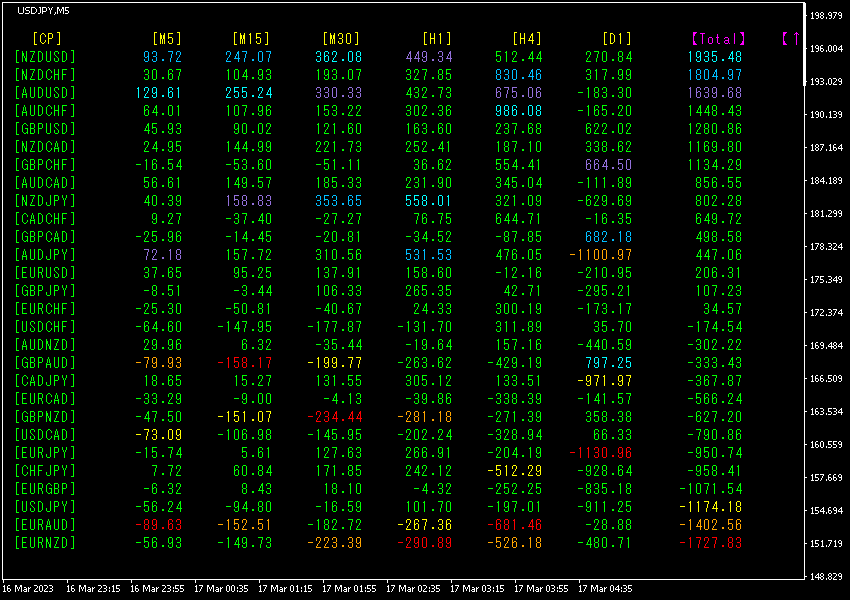
[Total] is sorted in descending order. Numerically, the trend is not very strong, but the top row'sNZDUSD shows a[M5][H1]28
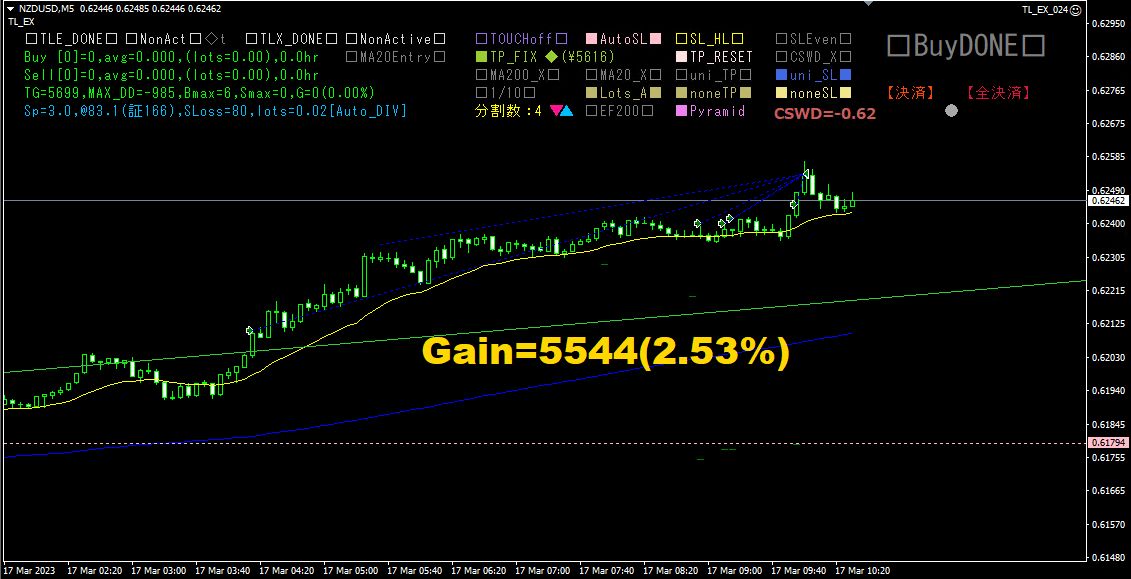
The above figure shows actual trading results. In addition to entry by Trend Line, manual averaging, and entry breaking MA20, Pyramid mode performed automatic additional buys. The chart is in an uptrend, MA20 is above MA200, and the moving averages' slope is rising to the right, so automatic cascading increases occurred. Profit obtained: .
Up to this point, total profit is\8,853 (win rate100%).
During short-time-frame trend formation, using "Trend Line EX" in split-entry mode and taking profits early without greed shows a very high win rate for profits.
Originally, "Trend Line EX" was developed as a semi-automatic EA intended to target larger profits on daily or higher timeframes, but using split-entry demonstrates it can also handle short timeframes like 1-minute or other small intervals effectively.
2. In conclusion
"Trend Line EX" continues to be updated in response to user feedback and requests, a constantly evolving EA. Currently at Ver5.00, new features such as "split-entry function" and "touch reverse-strike function" have been implemented. From daily trading to 1-minute scalping, it can be applied broadly as an EA, and we hope it will be a source of joy for users as well.
※"Trend Line EX"

https://www.gogojungle.co.jp/tools/indicators/42257
For those interested in the "8C Currency Strength Visualization Indicator," please refer to the following page.
MT4 version https://www.gogojungle.co.jp/tools/indicators/39150
MT5 version https://www.gogojungle.co.jp/tools/indicators/39159
【My products for sale】


