

Use of the "Visualization Indicator" (Part 85)
“Visualization Indicator” usage (Part85)”
【Special Edition】“Trend Line EX” how to use
As a Special Edition about how to use 【Trend Line EX】, as part of the “Visualization Indicator” series, we will introduce it.
1. “28 currency pairsBest Select indicator” to get an overview.
The “28 Currency Pairs Best Select Indicator” is also called the “FX Ticker Board,” and it is an indicator that allows you to judge at a glance the multi-timeframe analysis of all timeframes for all of the 28 currency pairs.
The decision to Trade or not Trade is instantly distinguishable by color coding and the magnitude of the evaluation numbers.
<Non-trade example>
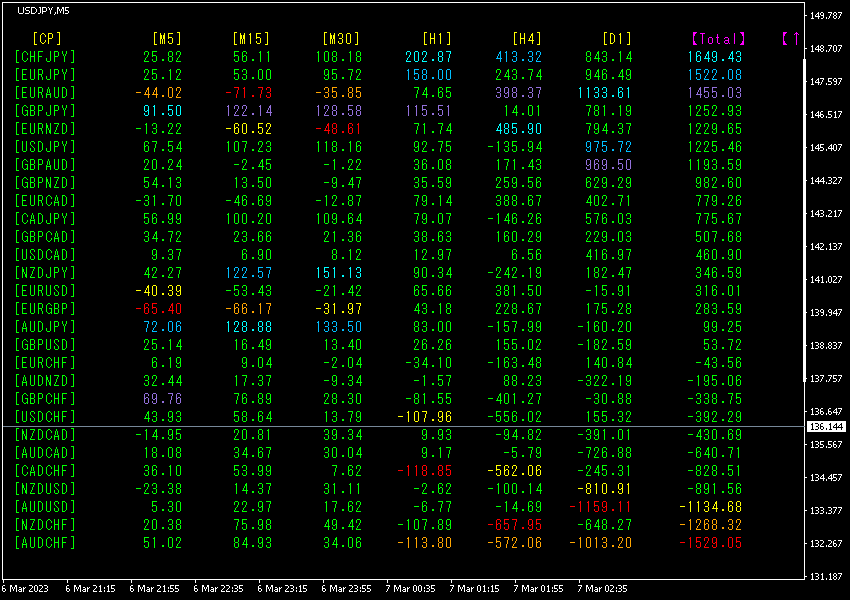
(2023 year 3 month 7 day 10:06)
All rows are not color-matched. Also the values do not exceed ±2000, so there is no trend. In such a market environment, it is better not to trade.
<Trade example>
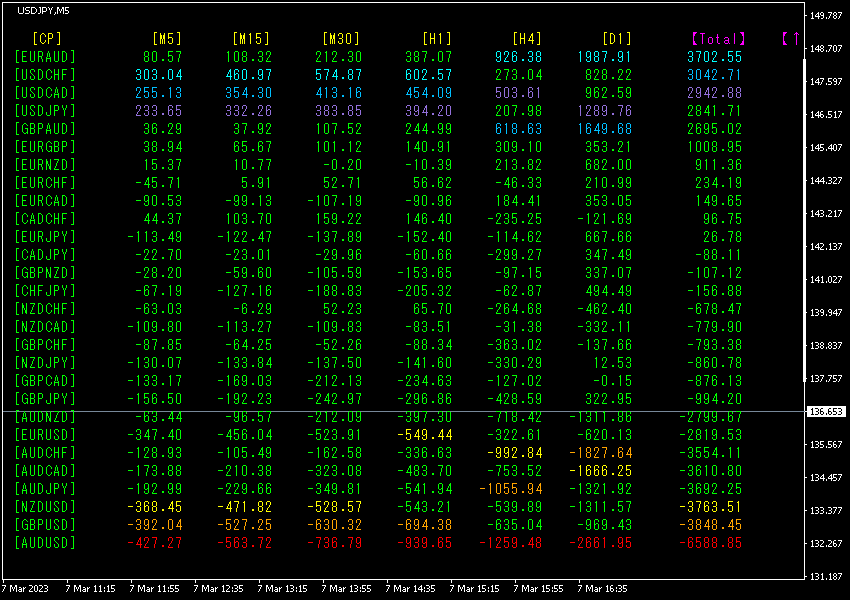
(2023 year 3 month day 00:06)
[Total]Sorted in descending order by values. The bottom rowAUDUSD shows all numbers in red and the Total value is-6588.85, indicating a strong downtrend.AUDUSD is showing a downward trend.
AUDUSD should be sold for trading.
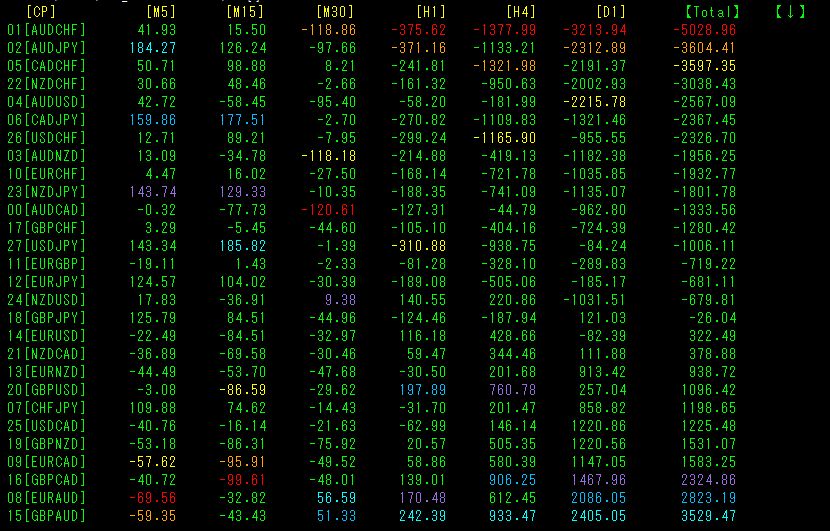
TotalSorted in ascending order. Please look at the top row [AUDCHF].
The value is negative and the largest,(), and [M30]~[D1] are negative, but [M5] and [M15] are positive.
2. “Look at the Daily Currency Strength Graph.”
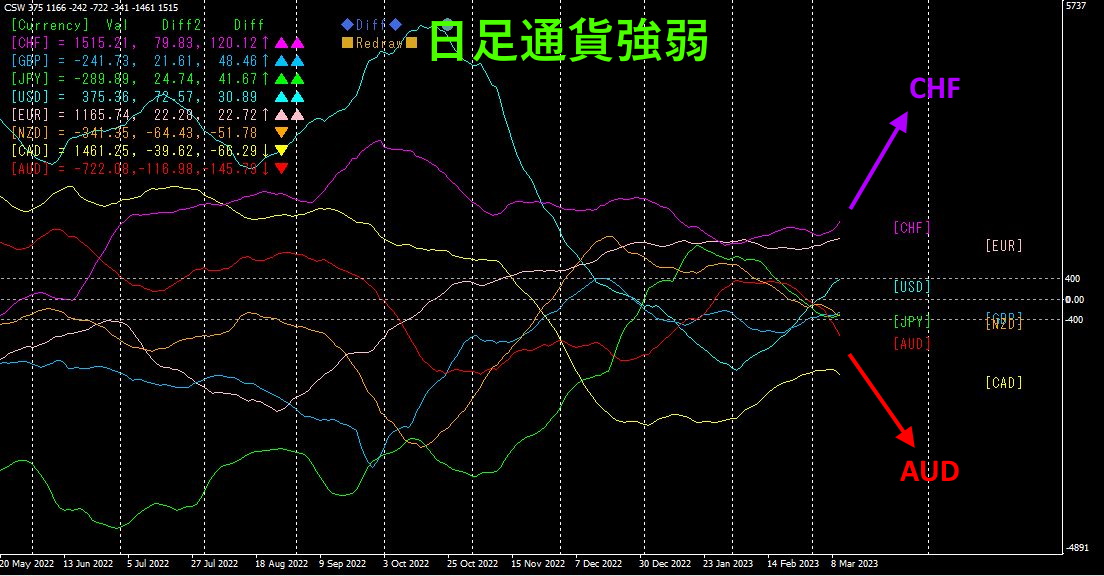
Against CHF rising at a sharp angle, AUD is dropping steeply. Looking at the daily currency strength graph as a whole, it seems to be moving from a convergence phase to a dispersion phase.
3. “Look at Visualization Indicators.”
We will use the Oceania version of the “8 CP Visualization Indicator.”
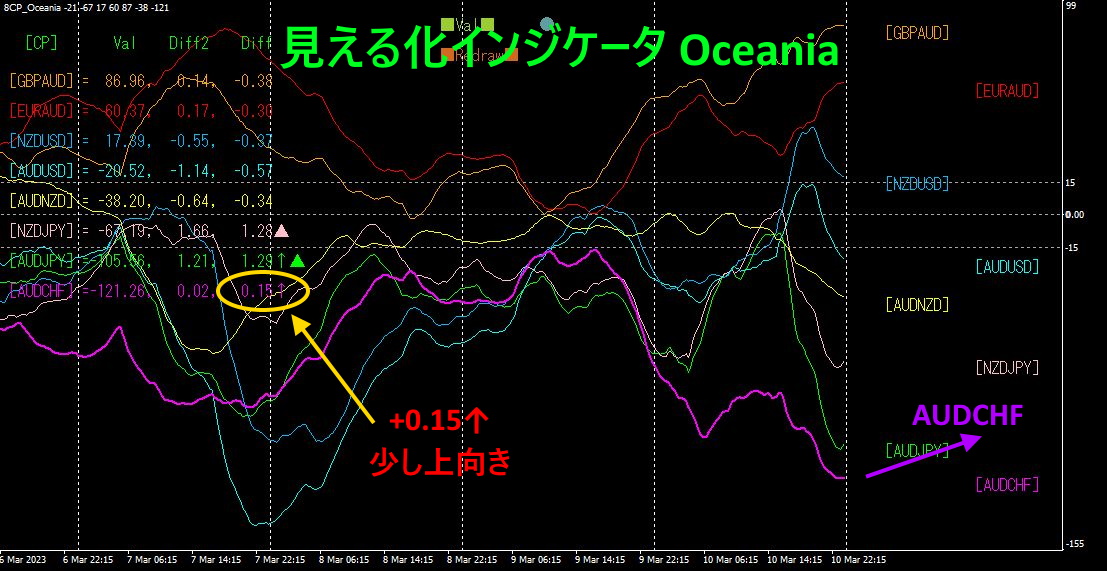
We introduced the Oceania version of the Visualization Indicator on the 15-minute chart.
AUDCHF is positioned at the bottommost, with a slight upward direction emerging.
4. “Ultimate Anti-Correlation Indicator”
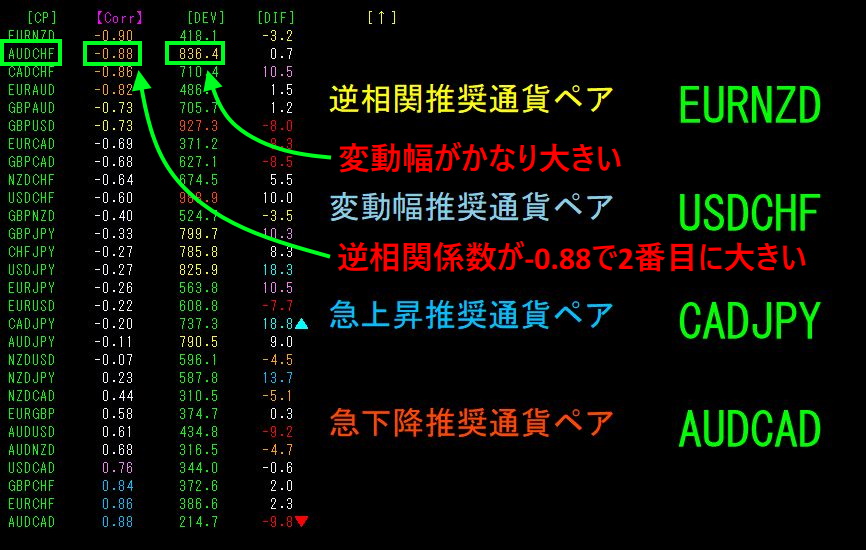
This was also introduced on the 15-minute chart. It is sorted in ascending order by Corr.
has large volatility and a correlation coefficient of, the second largest negative value (inverse correlation).
Below are the correlation coefficients when you change the timeframe.
D1-0.06
H4 -0.14
H1 -0.80
M15 -0.85ß the largest inverse correlation
M5 -0.50
The largest negative value among inverse correlations is at.
In inverse correlation, those with higher volatility are the targets, so if choosing a timeframe, I would pick the15
5. “Tops and Bottoms Search Indicator”
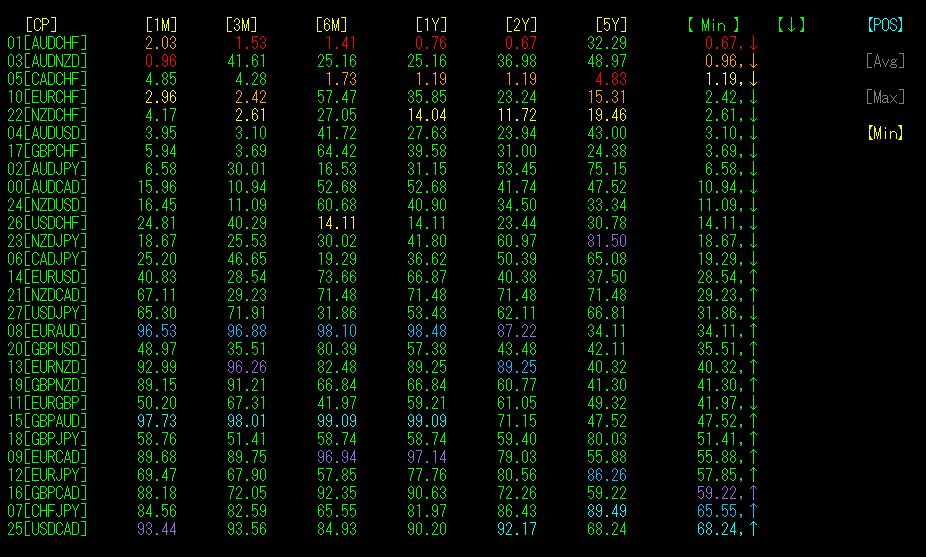
【POS】,【Min】 sorted in ascending order places the top at[AUDCHF]. months, months, year, years across all periods show that AUDCHF is at the lowest position (bottom) overall. This is a relative “tops and bottoms” indicator showing AUDCHF at a major bottom.
Moreover, in the 1-month period, the value becomes somewhat larger, suggesting a rebound from the bottom.
Now, with the above from 1. to 5., the market environment recognition using the Visualization Indicators and the technical analysis are complete.
The target is decided as “Buy AUDCHF,” so we will look at each timeframe’s chart.
6. View the AUDCHF chart.
We will look at weekly, daily, 4-hour, 1-hour, and 15-minute charts in order.
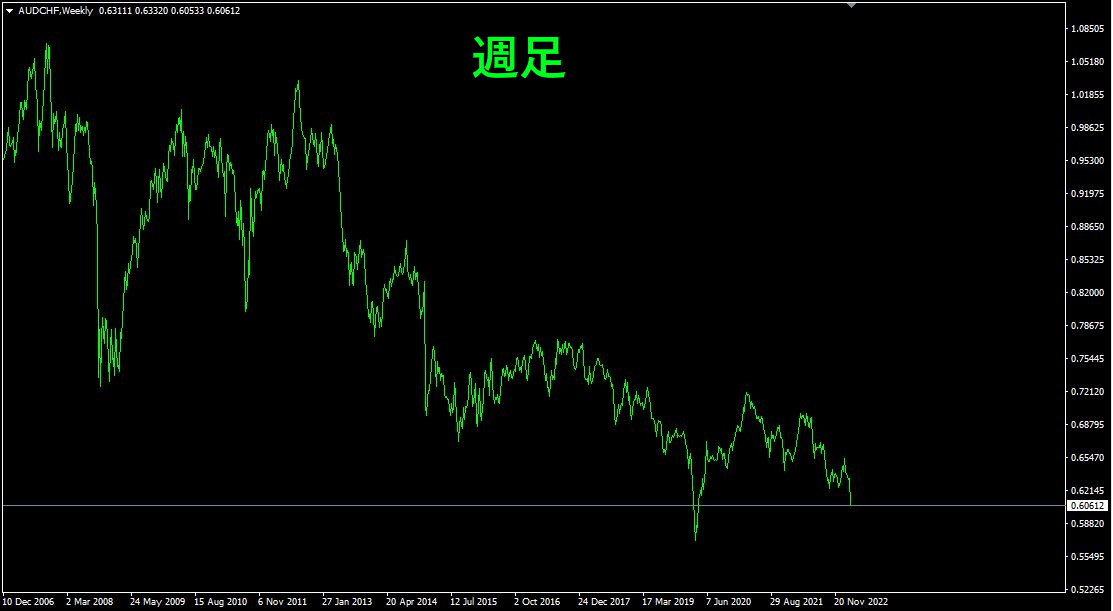
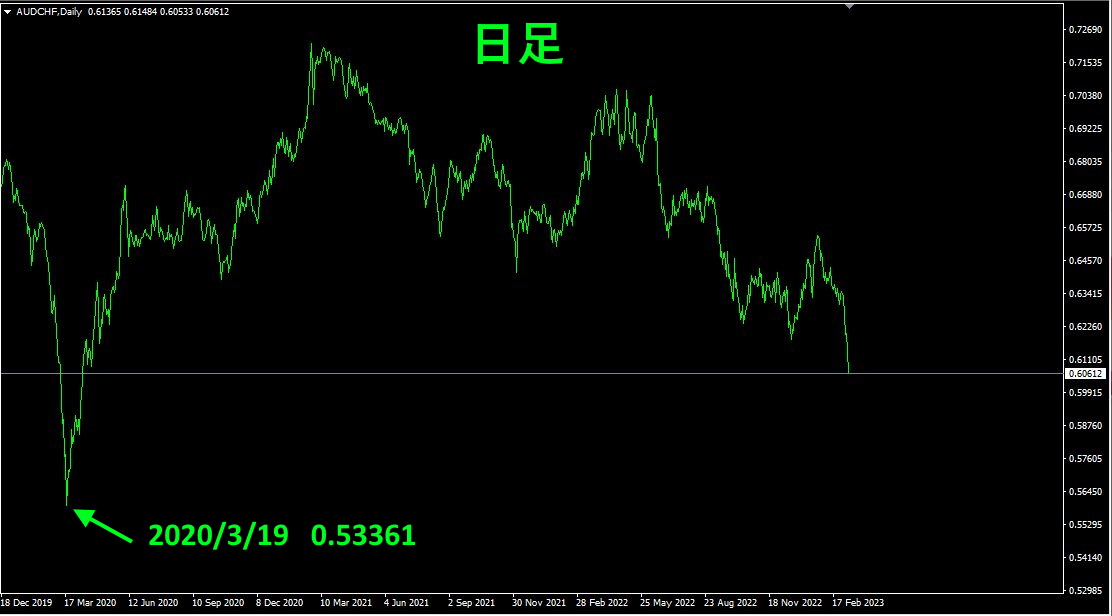
The nearest low on the daily chart is 0.53361 on 2020 year 3 month 19 day.
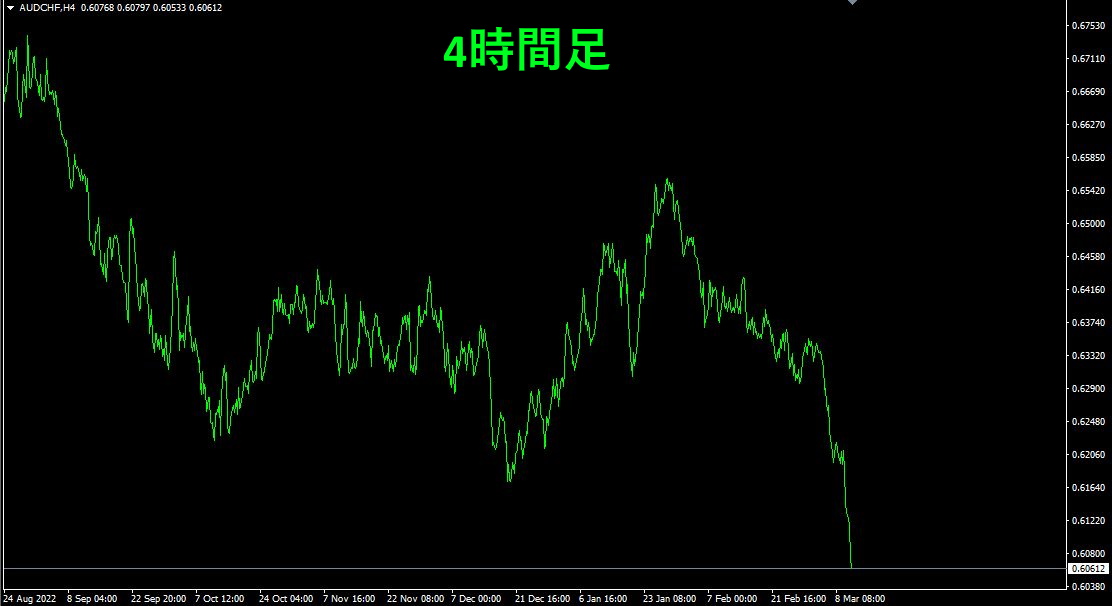
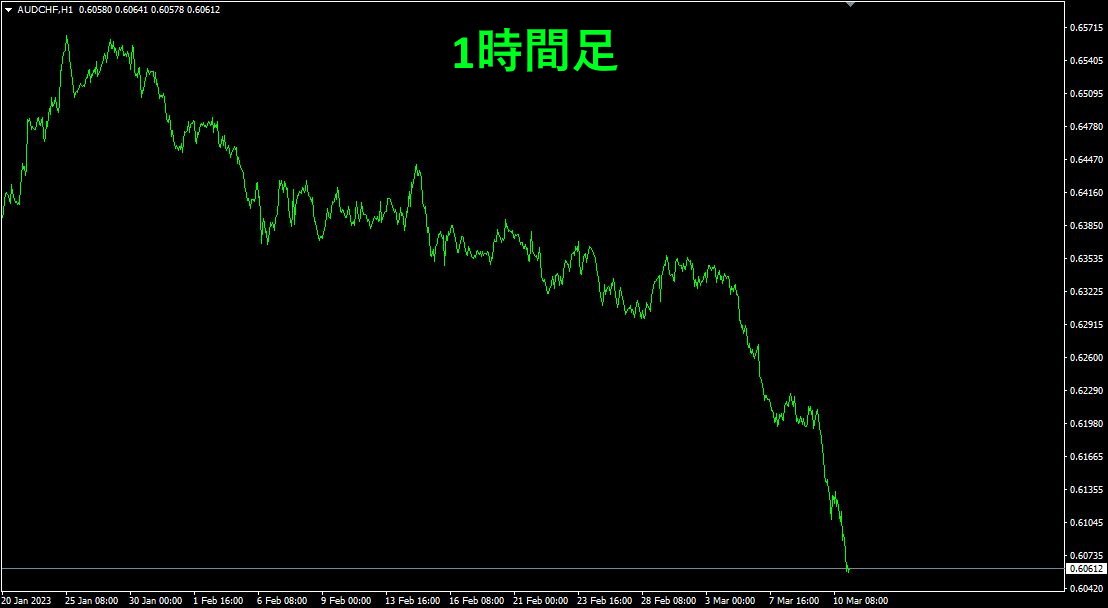
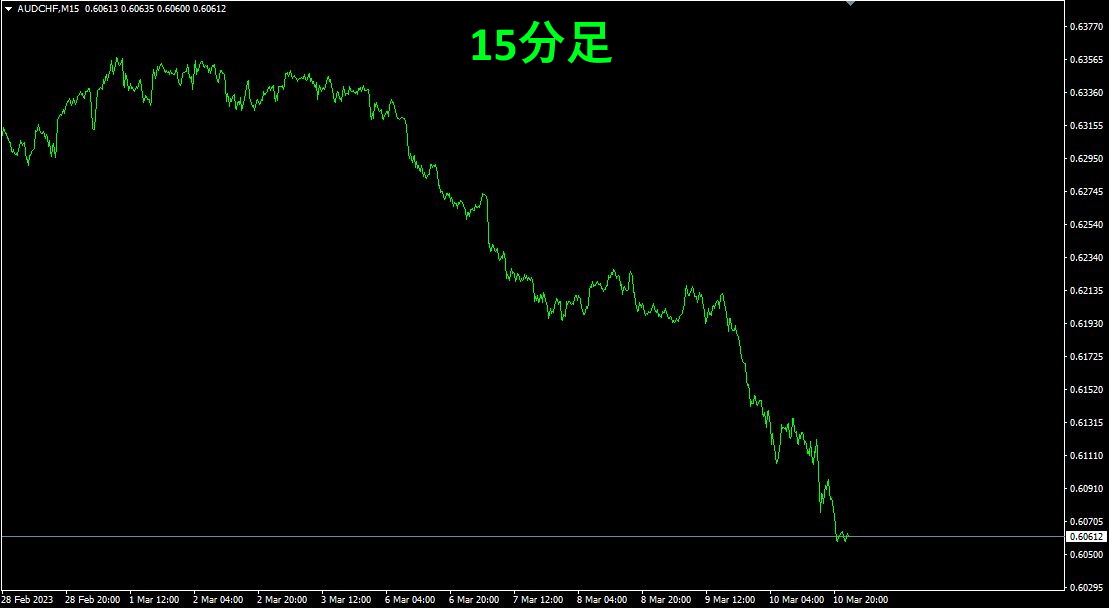
From weekly to 15 minutes, all have fallen in a downward trend. Overall, the pair is nearly at the bottom now.
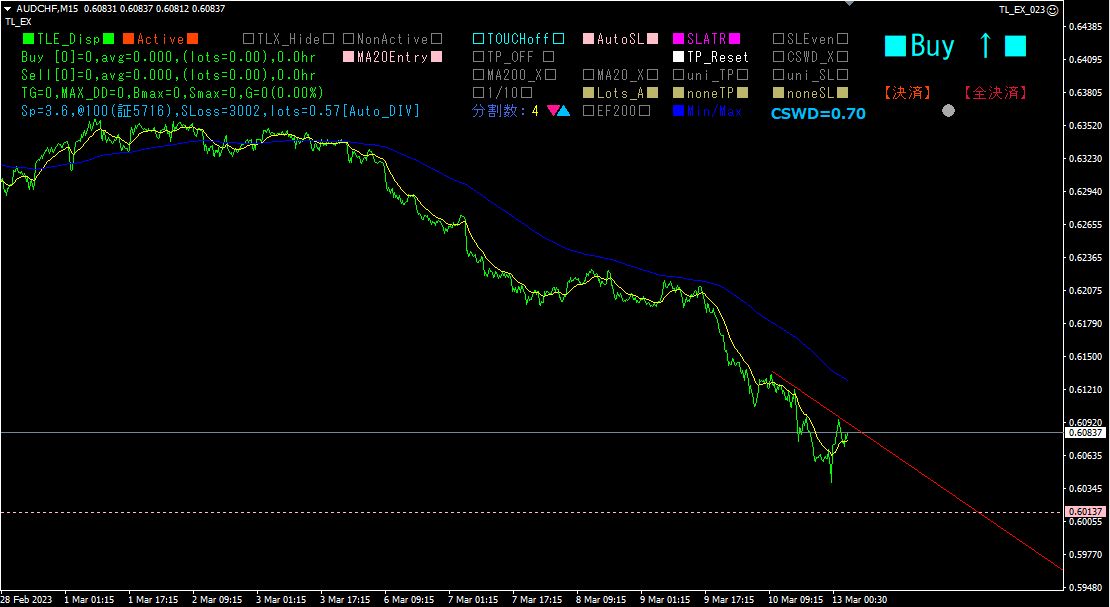
7. Settings for “Trend Line EX”
Introduce the Trend Line EX on the 15-minute AUDCHF chart.
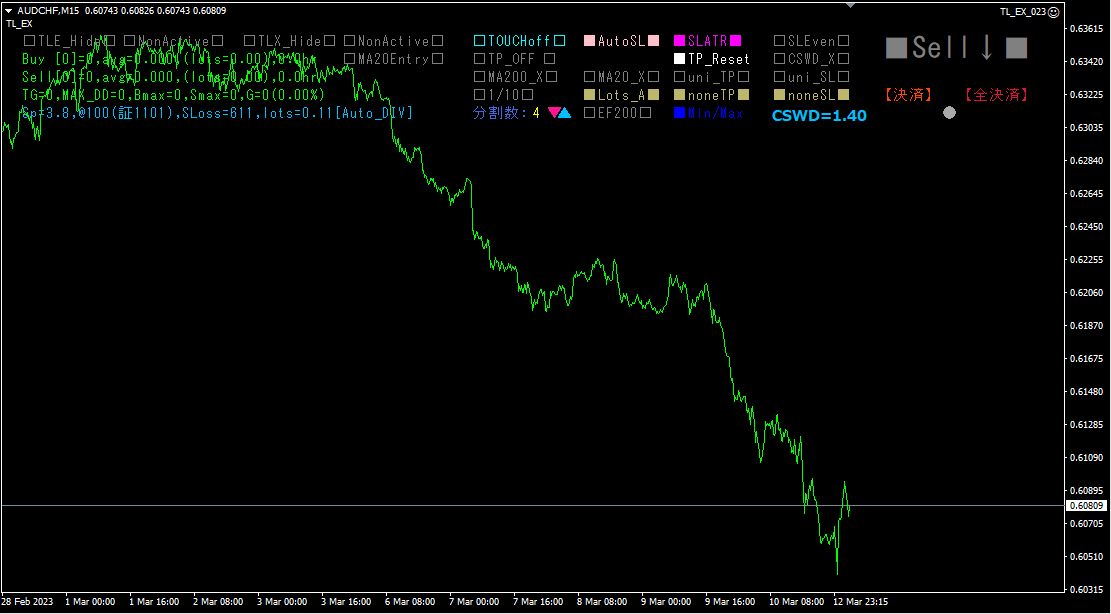
(1)/Sell designation
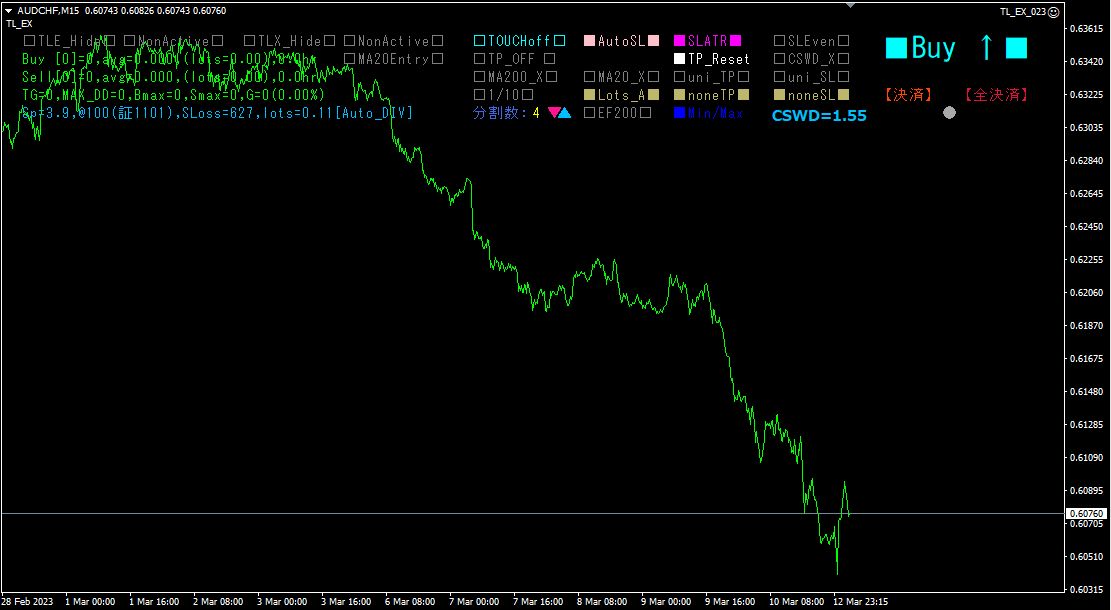
Since the current chart is in a downtrend, it is gray with■Sell↓■. Please click it with the mouse twice. After the first click, it becomes■Sell↓■, and after the second click it becomes■Buy↑■.
Now you have designated a 【buy】.
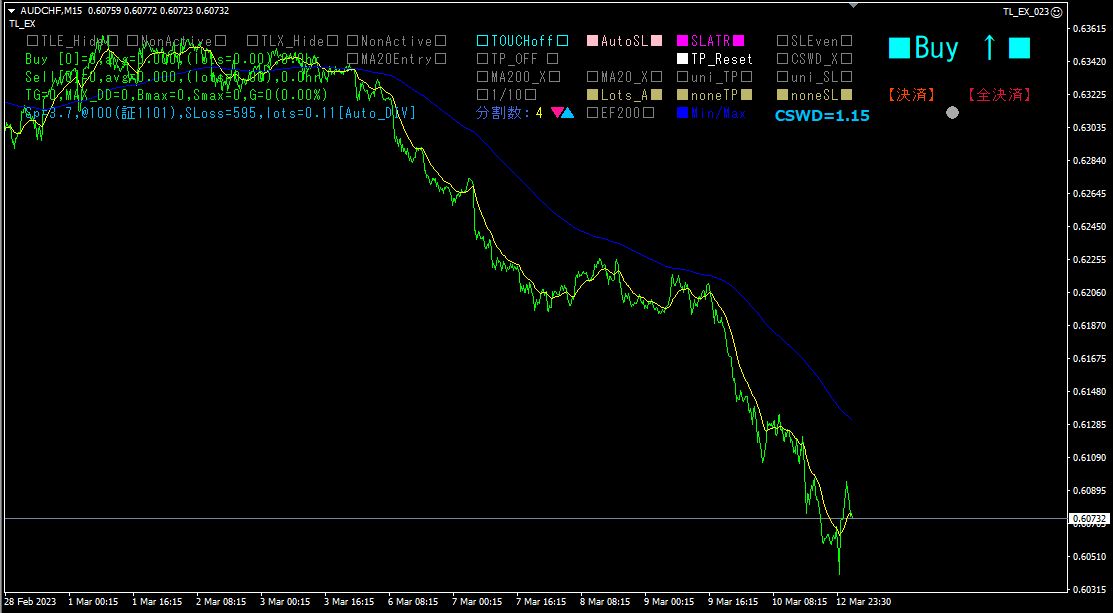
(2)Display of Moving Averages
Next, to make it easier to view, display two moving averages. comes with indicators > trend >. Use period, type of moving averagend Moving Average with period and color different from the first. In the example, blue.
Saved as a template so you can call it up next time.In MT4, right-click on the chart area > Template > Save Template and give it a name.
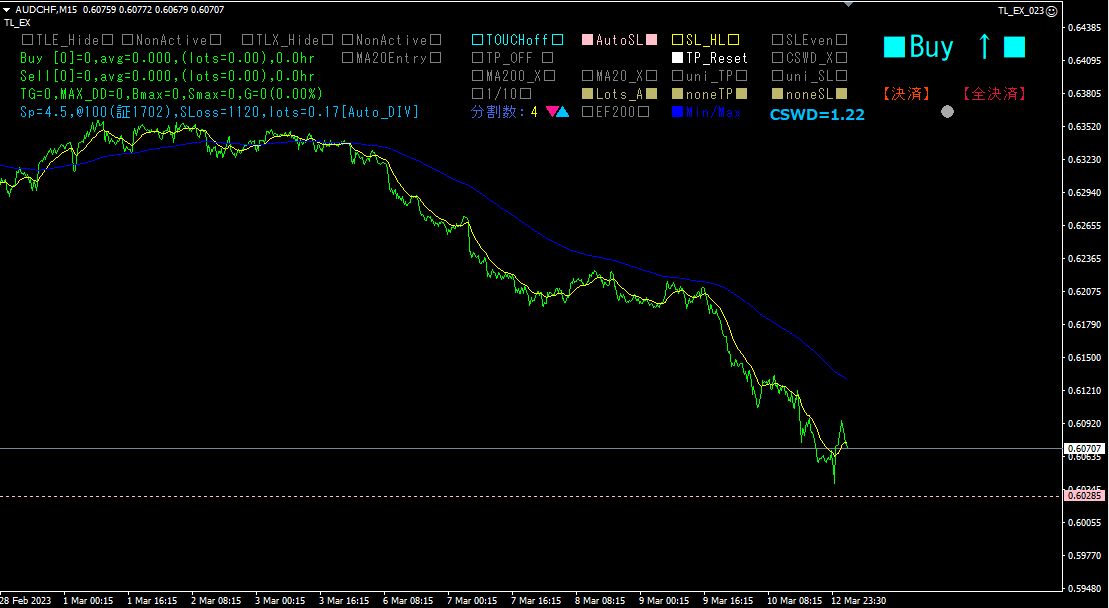
Clicking enables automatic stop loss and the lights up. At the same time, a pink stop-loss line appears as a horizontal line.
Stop-loss width can be chosen from two options: a) calculated from recent highs/lows and b) calculated from ATR.
Number of partitions and MA20 Entry setting
The number of partitions is set by parameter, but you can change it by clicking the ▼ and ▲ buttons on the MT4 screen. Click the [Partition Count:] area to set the number back to 1 (no division).
Lot size will automatically adjust according to the partition count.
Clicking changes display to, enabling automatic Entry when MA20 is crossed.
(5)
□□ Click to toggle display to■■, and trend lines will be drawn automatically.

If the position looks good, click to. The color of the trend line will turn red, and the Trend Line Breakout Auto Entry will become active.
From then on, just leave it alone; if the rate breaks above the trend line, or breaks above MA20, it will automatically enter a buy order.
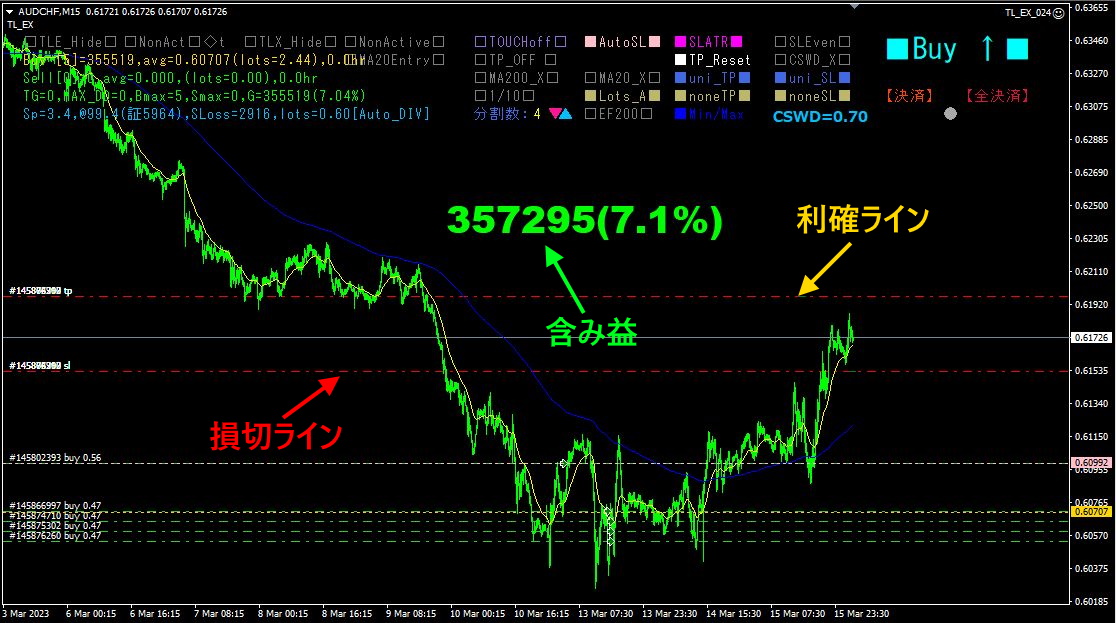
8.
In Trend Line EX Ver4.00 and later, a split-entry feature was added, so I tried this feature right away.
Total entries were 1 breakout entry plus 4 split entries, totaling 5 trades. The split-entry feature captured a deeper pullback well. As of 2023 year 3 month 16 day, there is substantial unrealized gain, so I manually set the take-profit line at 0.61965. By using the uni_TP feature for one chosen line, all four other lines can be set to the same value (the maximum value).
For safety, I also set the stop-loss line at 0.61527. This can be set in bulk with the uni_SL feature. Since the average entry price is 0.60707, even if the stop-out occurs, the profit margin of 0.00820 is guaranteed. With a lot size of 2.44, that is 2000.8 Swiss francs; at 1 CHF = 142.69, that amounts to roughly ₪285,494.
After that, you can simply wait. You will receive a take-profit notice by email or LINE.
Trading strategy is a very simple one: “buy at the bottom after a rebound!” By using the Visualization Indicator series, you can monitor the movement of 28 currency pairs and determine which pair to choose and when to trade, so that anyone can analyze it.
※“Trend Line EX”
https://www.gogojungle.co.jp/tools/indicators/42257
For those interested in the “8C Currency Strength Visualization Indicator,” please refer to the following pages.
version https://www.gogojungle.co.jp/tools/indicators/39150
version https://www.gogojungle.co.jp/tools/indicators/39159
【Products I have on sale】


