"ROUND UP" × "Line Scouter" Past Sign Verification
「ROUND UP」×「Line Scouter」トレード
・特徴 of each indicator

Capture turning points in the market and output signals at the first wave according to Elliott Wave Theory.
Risk-reward ratio1to1low-riskTP/SLis presented.

Analyzes multi-timeframe (MTF) chart information and displays high-accuracy support/resistance lines.
Regarding support/resistance lines, indicates the timeframe to watch and the strength of the lines using color and numbers.
・Merits of the combination
1.
Core logic of operation is the same, so they work well together.
2.
The market reverses at support/resistance lines, so by grasping the strength of the lines with 「Line
Scouter」, you can add a basis for entry to the signals of 「ROUND UP」.
3.
Since the market reverses at support/resistance lines, by grasping their strength with 「Line
Scouter」, you can visualize the price movement influenced by lines between the entry point and the TP.
・Entry rules
① Use reversals at resistance/support lines as the basis for entry.
SLA bar that forms a hammer and reverses at the resistance/support line is the basis for the baseline.
② Use moves that break out of the resistance/support line as the basis for entry.
Entry occurs when the price breaks out from the resistance/support line between the SL point and the entry point.
③
From the entry point toTPpoint, there is no strong resistance/support line.
※Notes: On charts with timeframes larger than the chart you are trading, resistance/support lines may appear as noise (false breakouts). In some cases the line is crossed greatly and reverses, but when you synthesize bars to higher timeframe bars, it looks like the line has a hammer reacting at the resistance/support. Be mindful of timeframe and bar closing times and imagine a synthetic bar. The resistance/support acts more like a resistance zone rather than a single line.
Not only the signals of “ROUND UP,” but the accuracy of the resistance/support lines shown by “Line Scouter
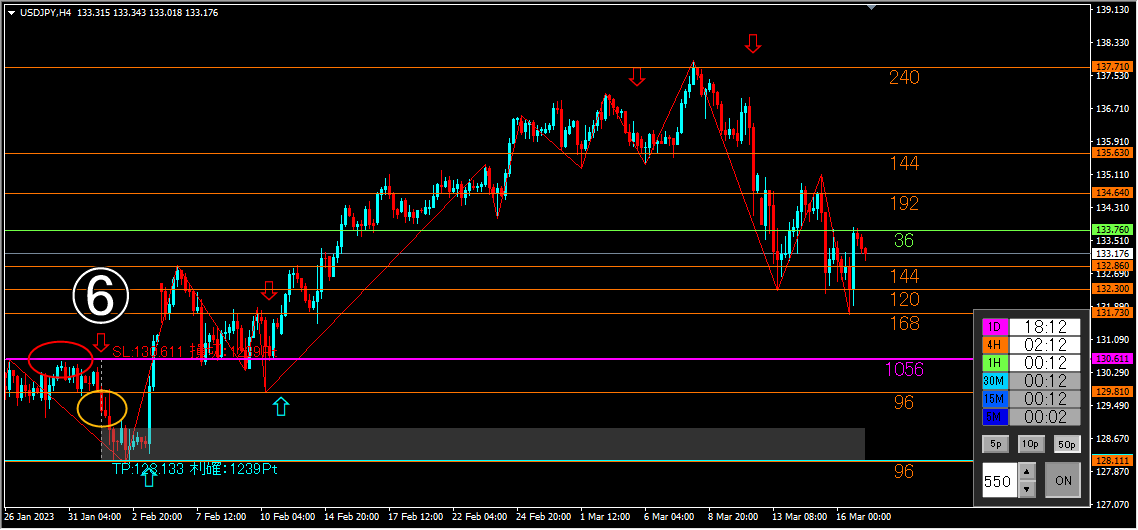
◎4-hour chart
Verification of SIX signals①–⑥ of the “ROUND UP” output on USD/JPY 4-hour chart.
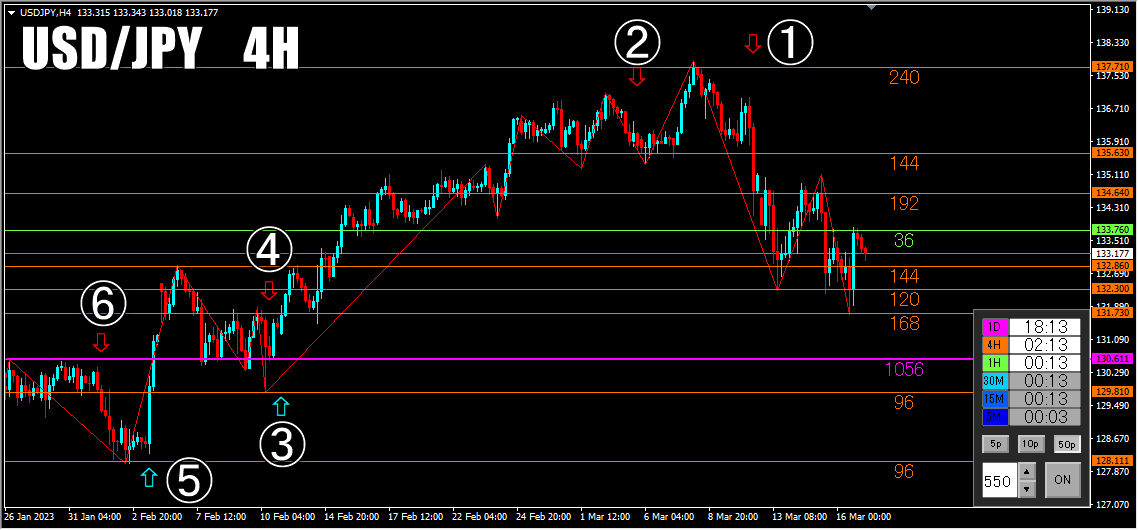
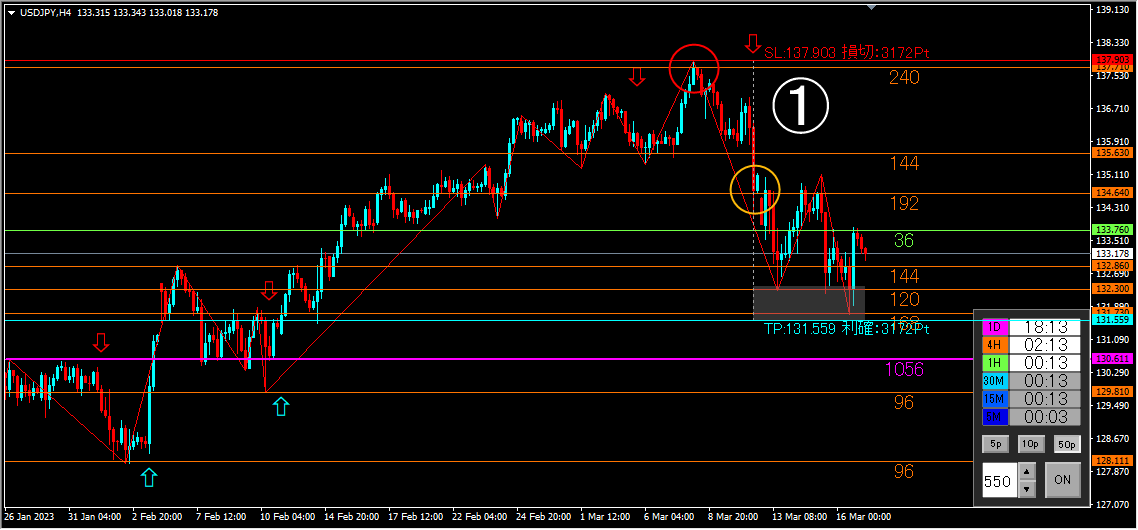
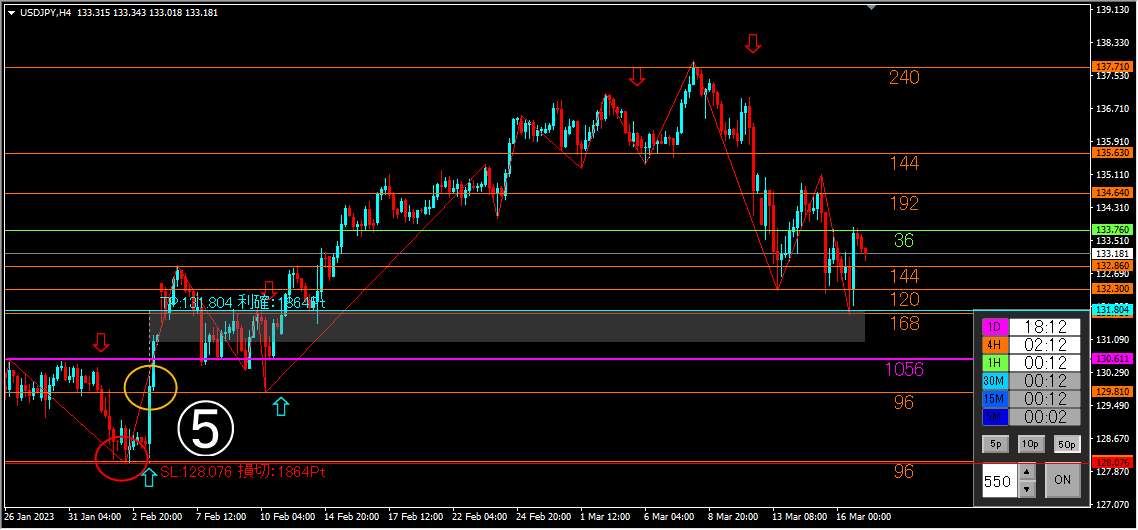
① SL point near red circle, on the 4-hour chart, reverses at the orange line (240) and moves downward.
Near the yellow circle there is a strong resistance/support line directly under the entry point (less than 240), which is fine.
Enter, and take profit at 317 pips.
② There is no resistance/support line near the SL point red circle.
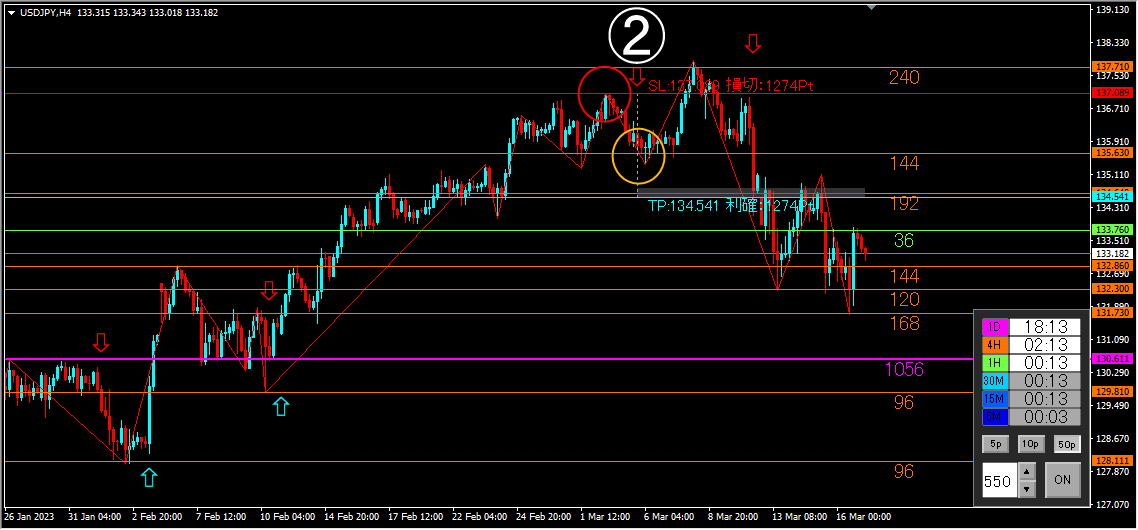
③ Near the SL point red circle there is a strong purple line (1056) on the daily chart. Wait for a breakout within a range.
Enter,187 PIPS take profit.
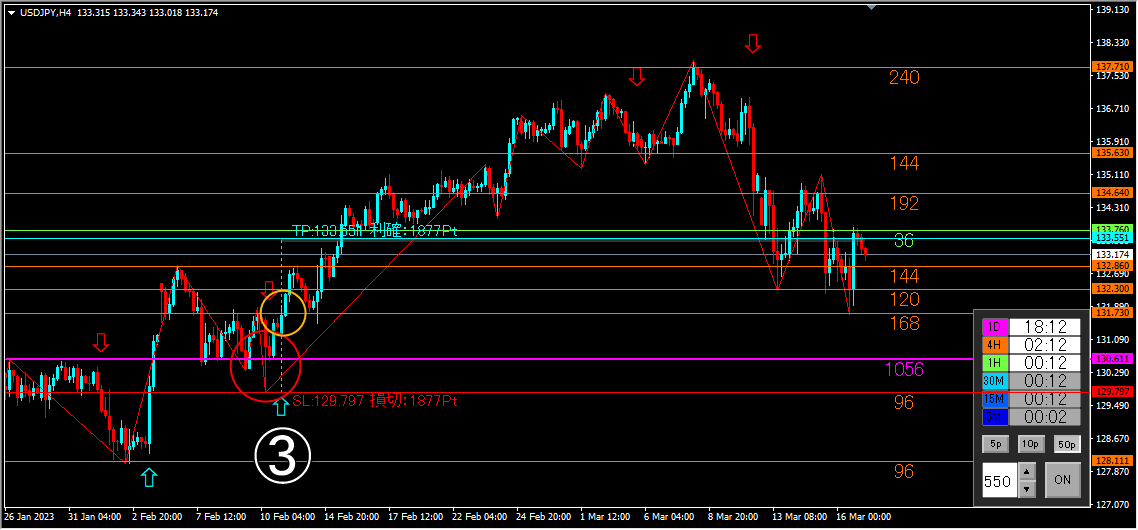
④ There is an orange line (168) near the SL point red circle on the 4-hour chart, but between entry and TP there is a strong purple line on the daily chart (1056), so entry is skipped.
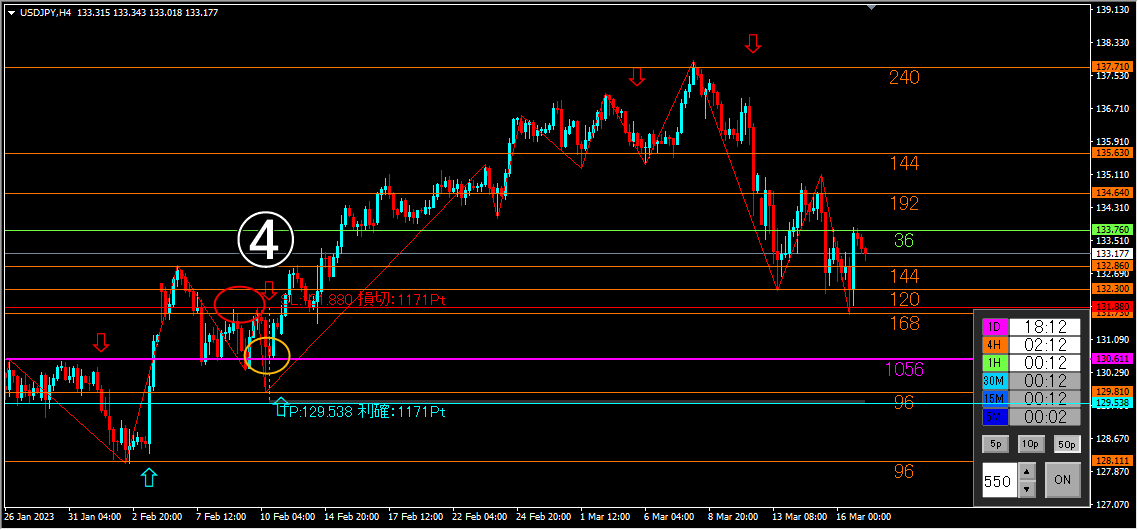
Enter,123 PIPS take profit.
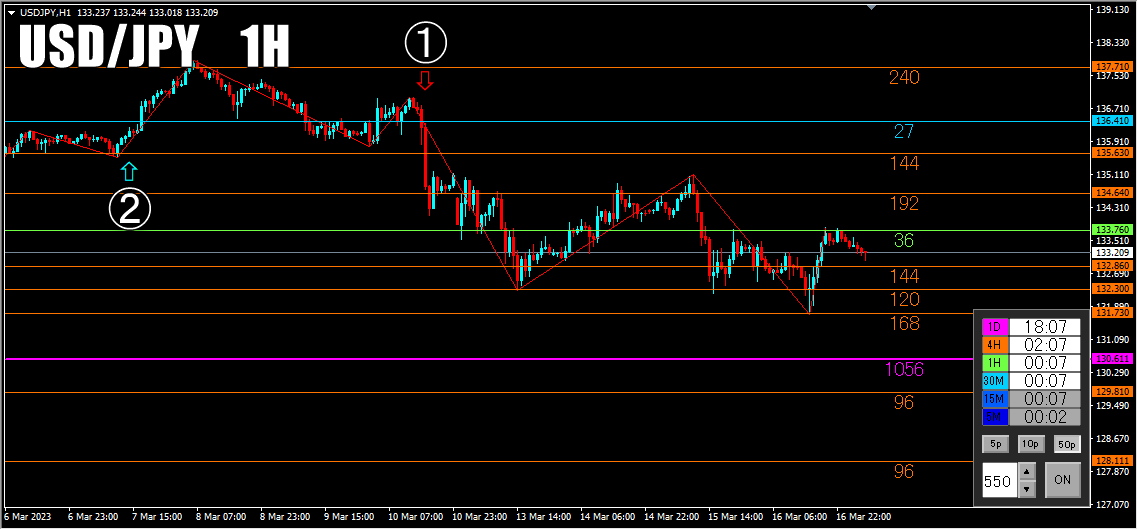
◎1-hour chart
Verification of the “ROUND UP” signals ①–② output on USD/JPY 1-hour chart.
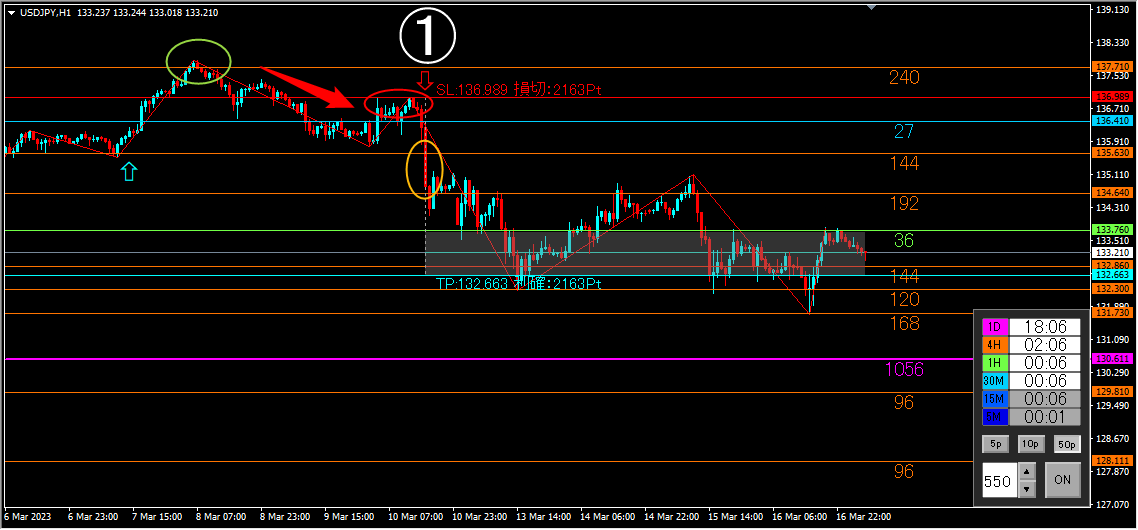
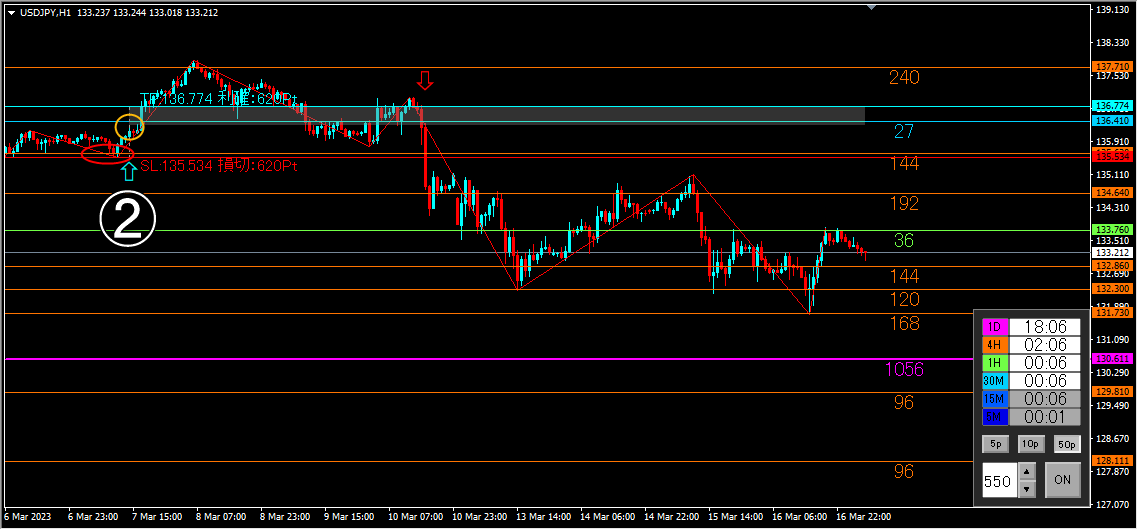
① There is no resistance/support line near the SL point red circle.
The entry point yellow circle is a strong breakout through the orange line (144) on the 4-hour chart.
There is no line stronger than (144) until the TP.
Enter,216 PIPS take profit.
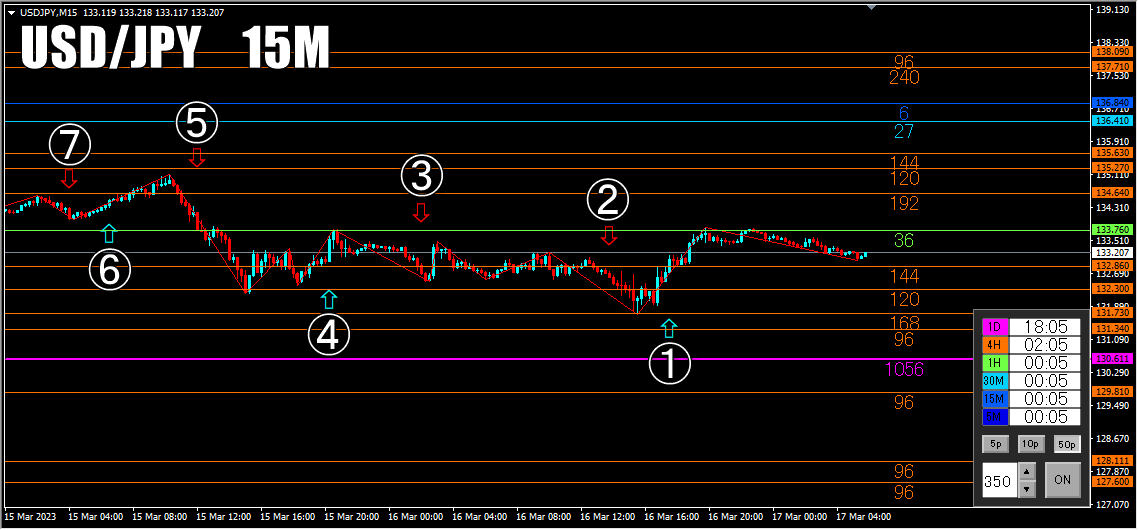
◎15-minute chart
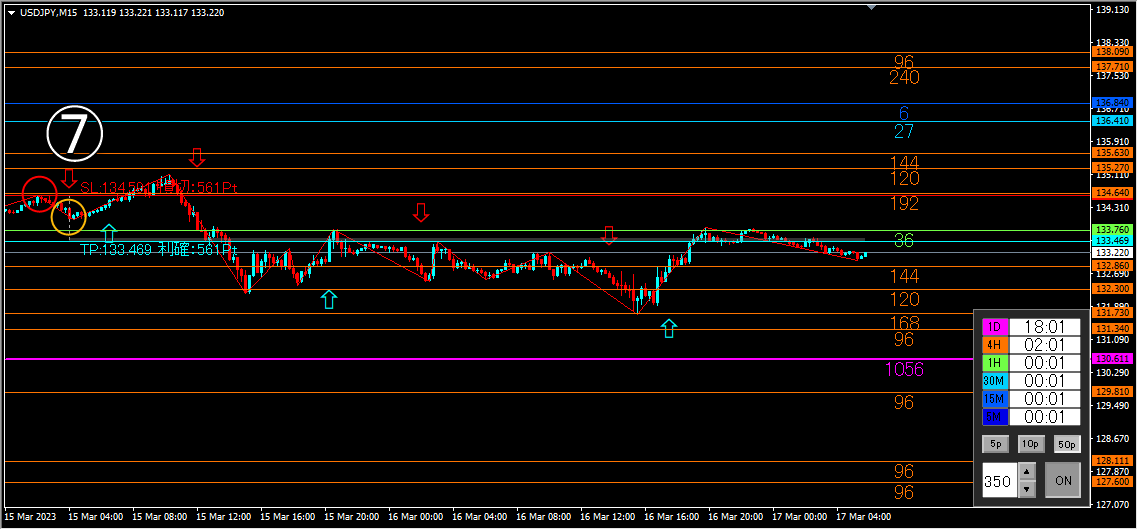
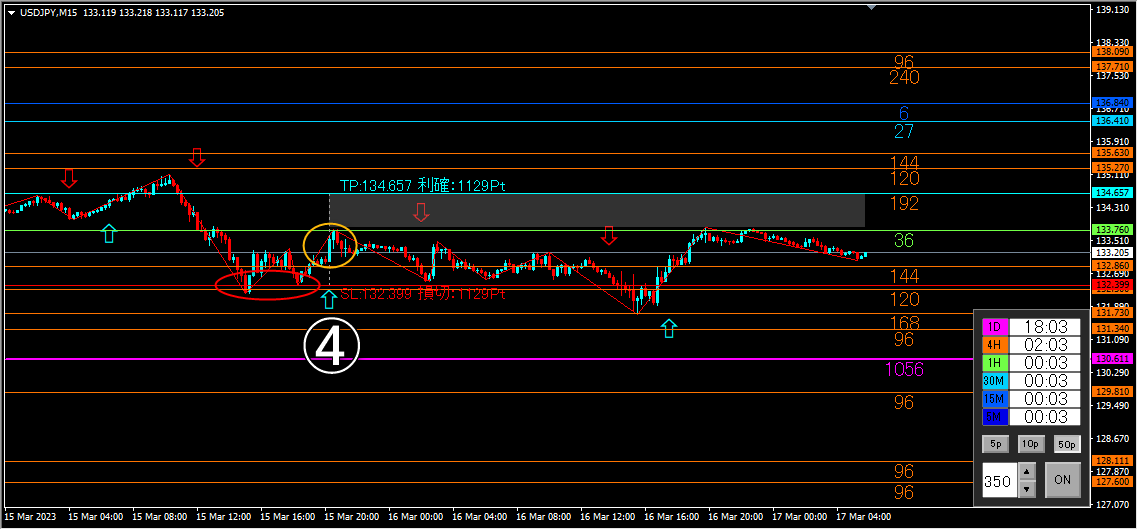
Verification of the “ROUND UP” signals ①–⑦ on USD/JPY 15-minute chart.
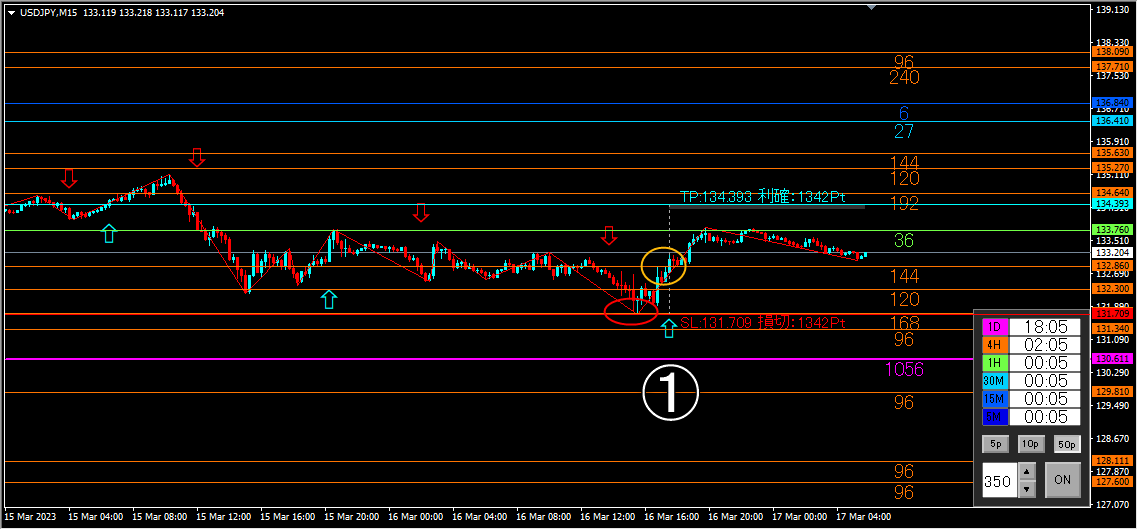
①SL point near red circle Rebound at the orange line (168) on the 4-hour chart and move up.
Near the yellow circle, entry point breakout through the orange line (144) that the 4-hour chart watches.
There is no line stronger than (168) until the TP.
Enter, then134 PIPS stop loss.
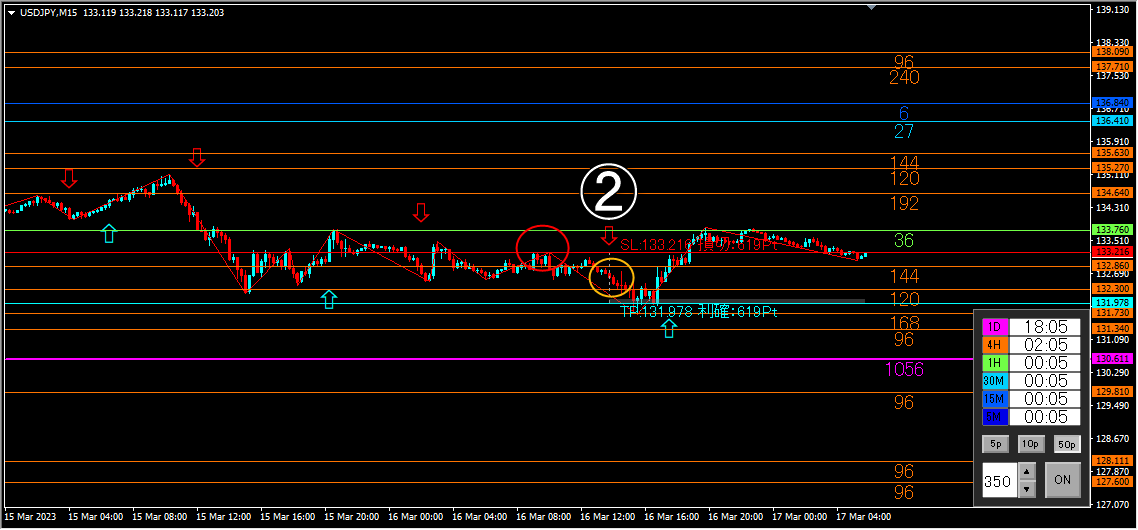
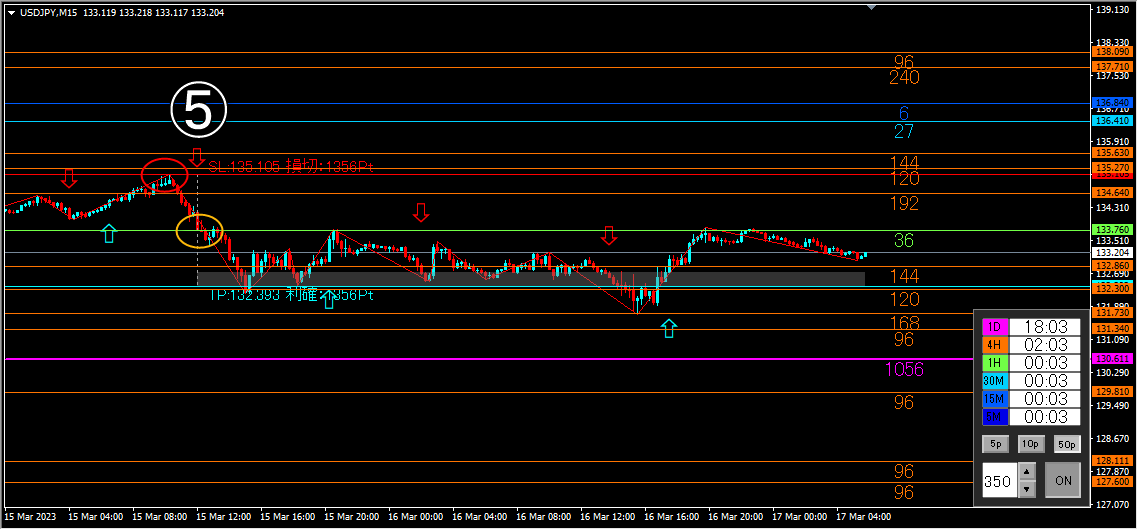
②SL point near red circle; no resistance/support line.
Near the yellow circle entry point, breakout through the orange line (144) watched by the 4-hour chart.
Enter,61 PIPS take profit.
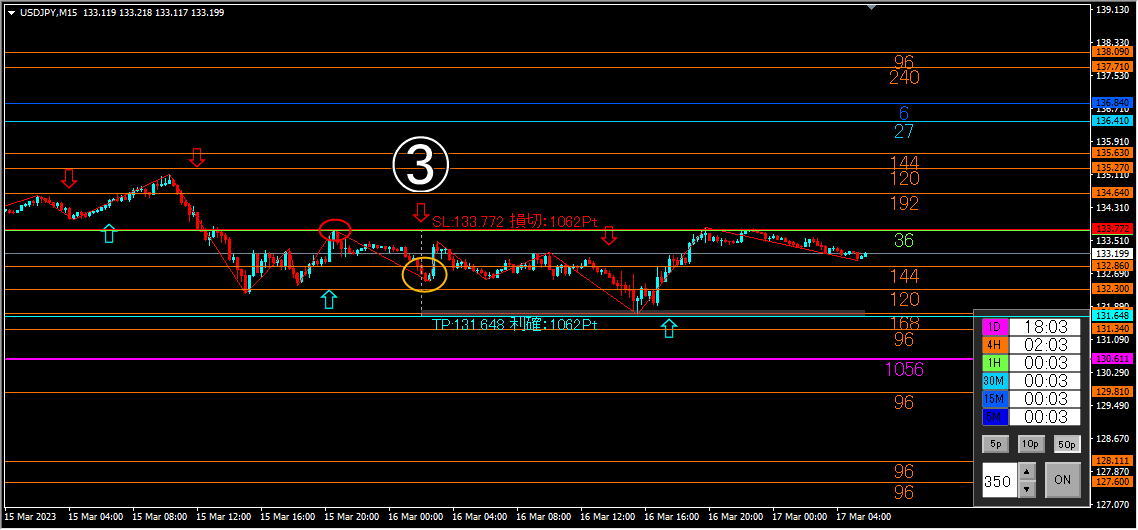
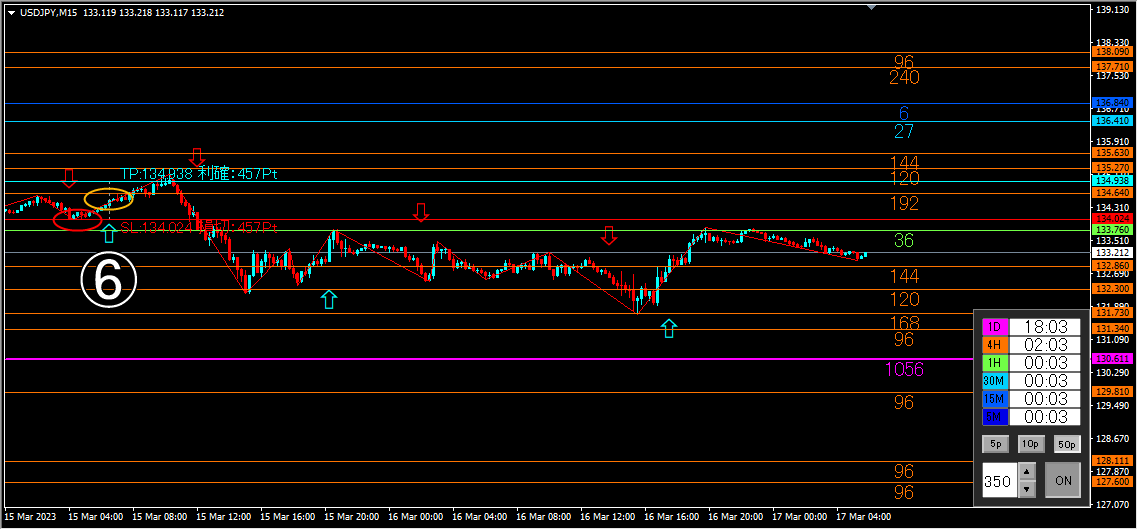
SL point near red circle is a green line (36) on the 1-hour chart that rebounds and trends downward.
Near the yellow circle, breakout through the orange line (144) watched by the 4-hour chart.
There is no stronger line than (144) until the TP. (Strictly, there is a (168) just before TP, but within the TP zone, so okay.)
Enter,106 PIPS take profit.
Near the yellow circle, breakout through the orange line (144) watched by the 4-hour chart.
There is no line stronger than (144) until the TP.
Enter,112 PIPS take profit.
Near the yellow circle entry point breakout through orange line (192) watched by the 4-hour chart.
There is no line stronger than (192) until the TP.
Enter,135 PIPS take profit.
Near the yellow circle, no resistance/support line.
Condition not met, entry skipped.
Near the yellow circle, no resistance/support line.
Enter, then56 PIPS stop loss.