
Today’s scenario USD/JPY
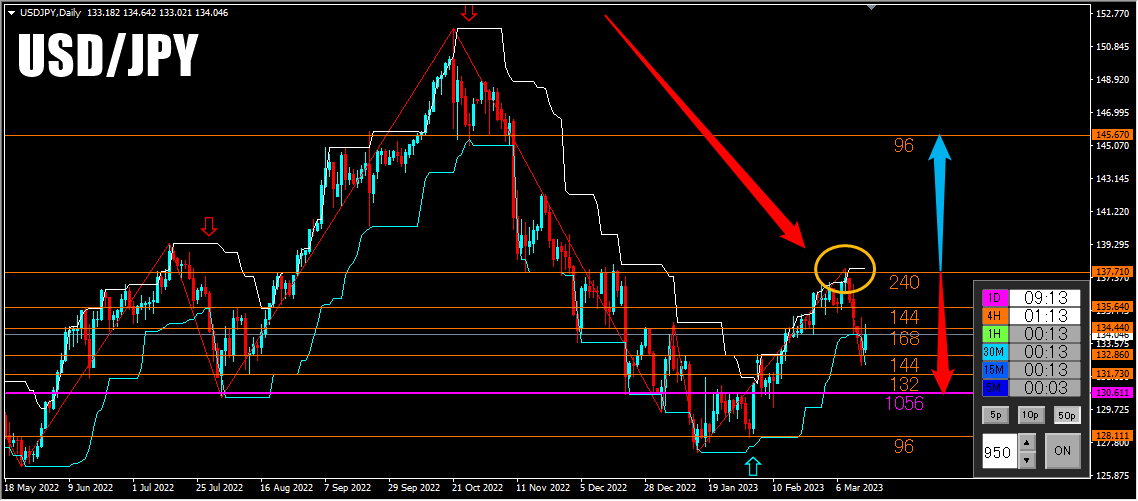
USD/JPY daily chart
In a downtrend with a pullback, looking to sell. Until the purple line (1056) that is watched on the daily chart, it should fall,
or a situation where it rises after a pullback from here.
4-hour chart.
Reversal to the downside from the orange line (240) that is watched on the 4-hour chart.
Further pullback to the orange line (168) and forming a breakout with a wick returning,
we are considering a sell entry scenario aiming to take profit around the purple line (1056).
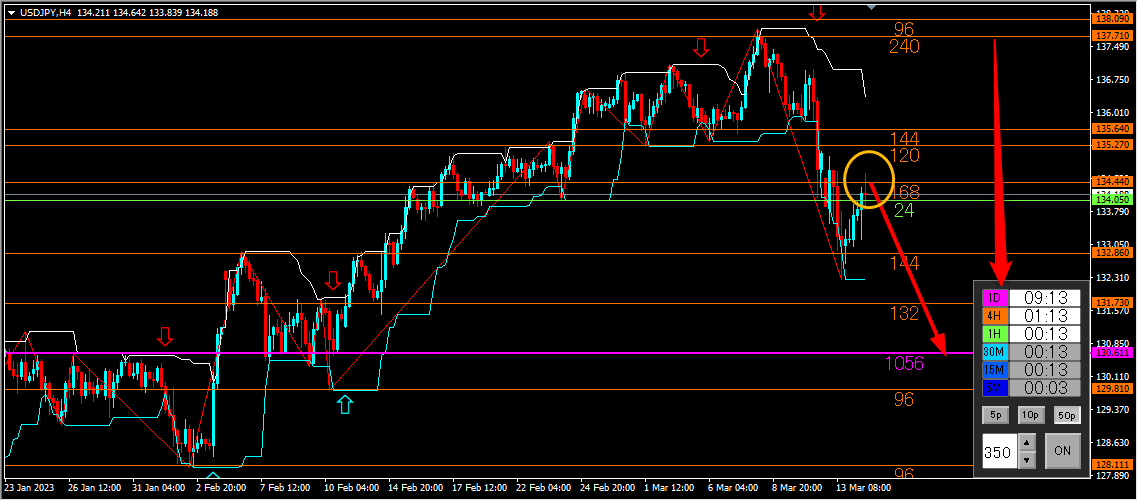
1-hour chart
The entry trigger is when the green line (24), watched on the 1-hour chart, forms a downward move after a pullback on the 1-hour or 15-minute chart.
