
March 10, 2023 FX Trading Strategy "Today's Move" Gogojan Edition
Hello there!
This is Tatsuron.
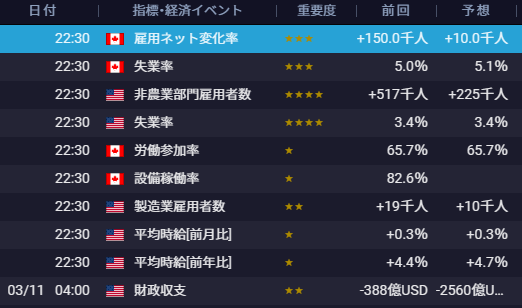
Today is the second day of the three-day U.S. indicators, with U.S. unemployment benefits data.
Here is the USD/JPY trading strategy!
USD/JPY 1-hour chart
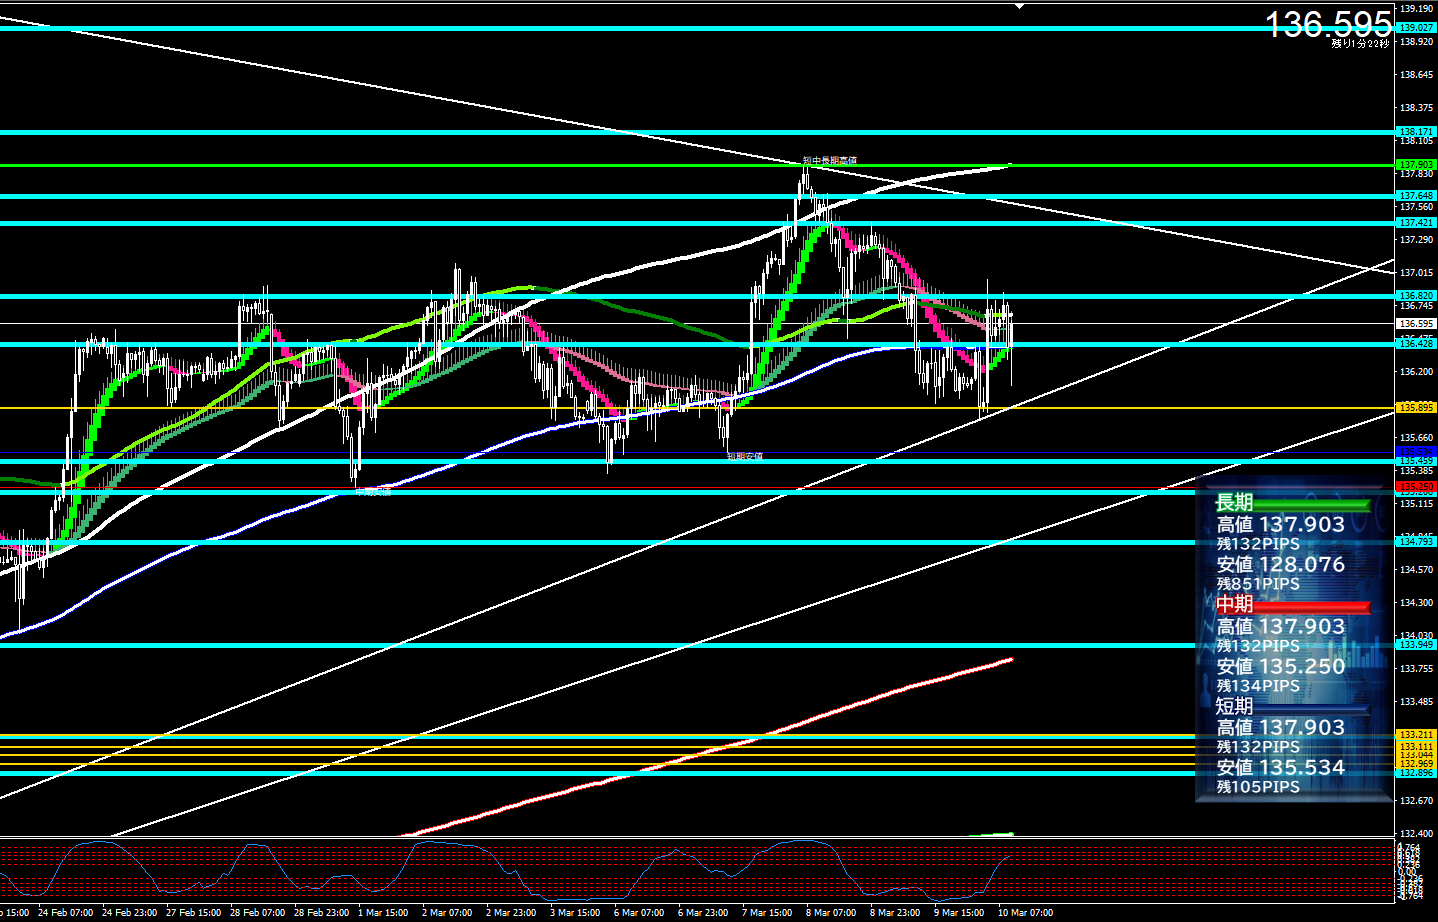
USD/JPY Trading Strategy
Long Entry Points
① Around 137.089 to 137.421 yenBreak
② Around 138.171Break near the yen
③ Around 132.896to 133.211 yen reversal
Break Strategy
① Break of 137.089–137.421 may show the potential for a new high and the previous support not becoming resistance, creating upside momentum. If it surges from the lower side and triggers stops, it’s a target.
If the price heads upward, this range will continue to be relevant next week.
② If it breaks above around 138.171, we may see a move toward 140. Will we watch this number until ADP to non-farm payrolls next week? We will be prepared.
Reversal Strategy
③ Reversal from 132.896 to 133.211 is expected to position lower. It becomes a support range around the 130s, or a bounce into the 120s, so this is an important price zone for a downward move.
Short Entry Points
① Around 135.895 break
② Around 135.206 to 135.459 break
③ Around 136.428 to 136.820 reversal
Break Strategy
① Break near 135.895 is, today alone, the most reproducible point. We again target the break of the uptrend line and the 200-period MA on the 1-hour chart.
② 135.206 to 135.459 is a resistance-turned-support zone where former resistance and recent support mix.
If broken, the flow moves toward the low 130s.
Reversal Strategy
③ 136.428 to 136.820 is a recent resistance zone.
This zone has been tested repeatedly. It’s a zone where profits can be booked smoothly, a “lucky hammer” zone.
Sooner or later, it has a high likelihood of becoming a starting point for a breakout, so it’s a high-risk, high-reward zone.
Today’s indicators