
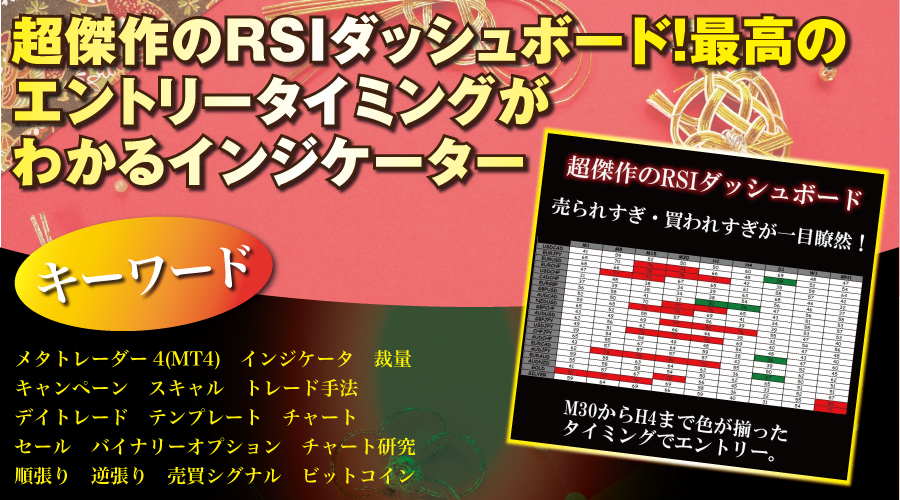
An ultra-masterpiece RSI dashboard! An indicator that tells you the best entry timing.

https://www.gogojungle.co.jp/tools/indicators/31777
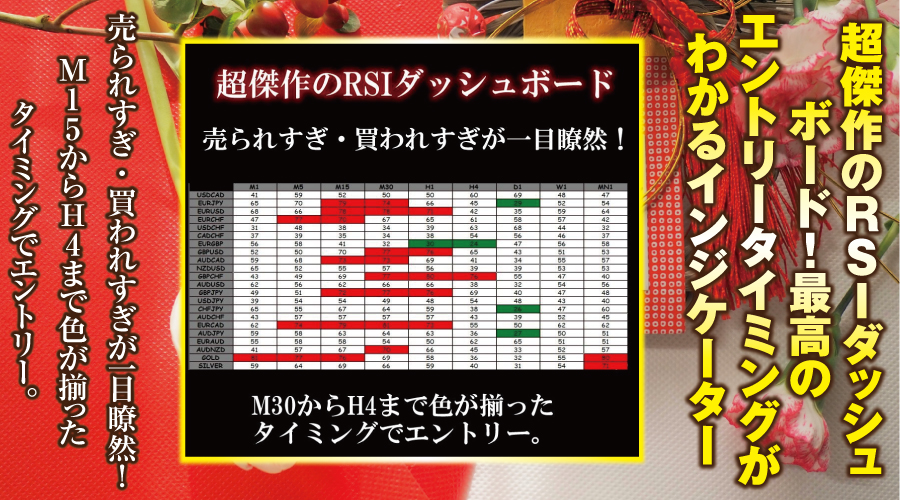
An outstanding RSI dashboard! It becomes an indicator that shows the best entry timing. Recommended for those aiming to become full-time traders. Overbought and oversold are clearly visible, and entries are made when the colors align from M15 to H1 (H4).
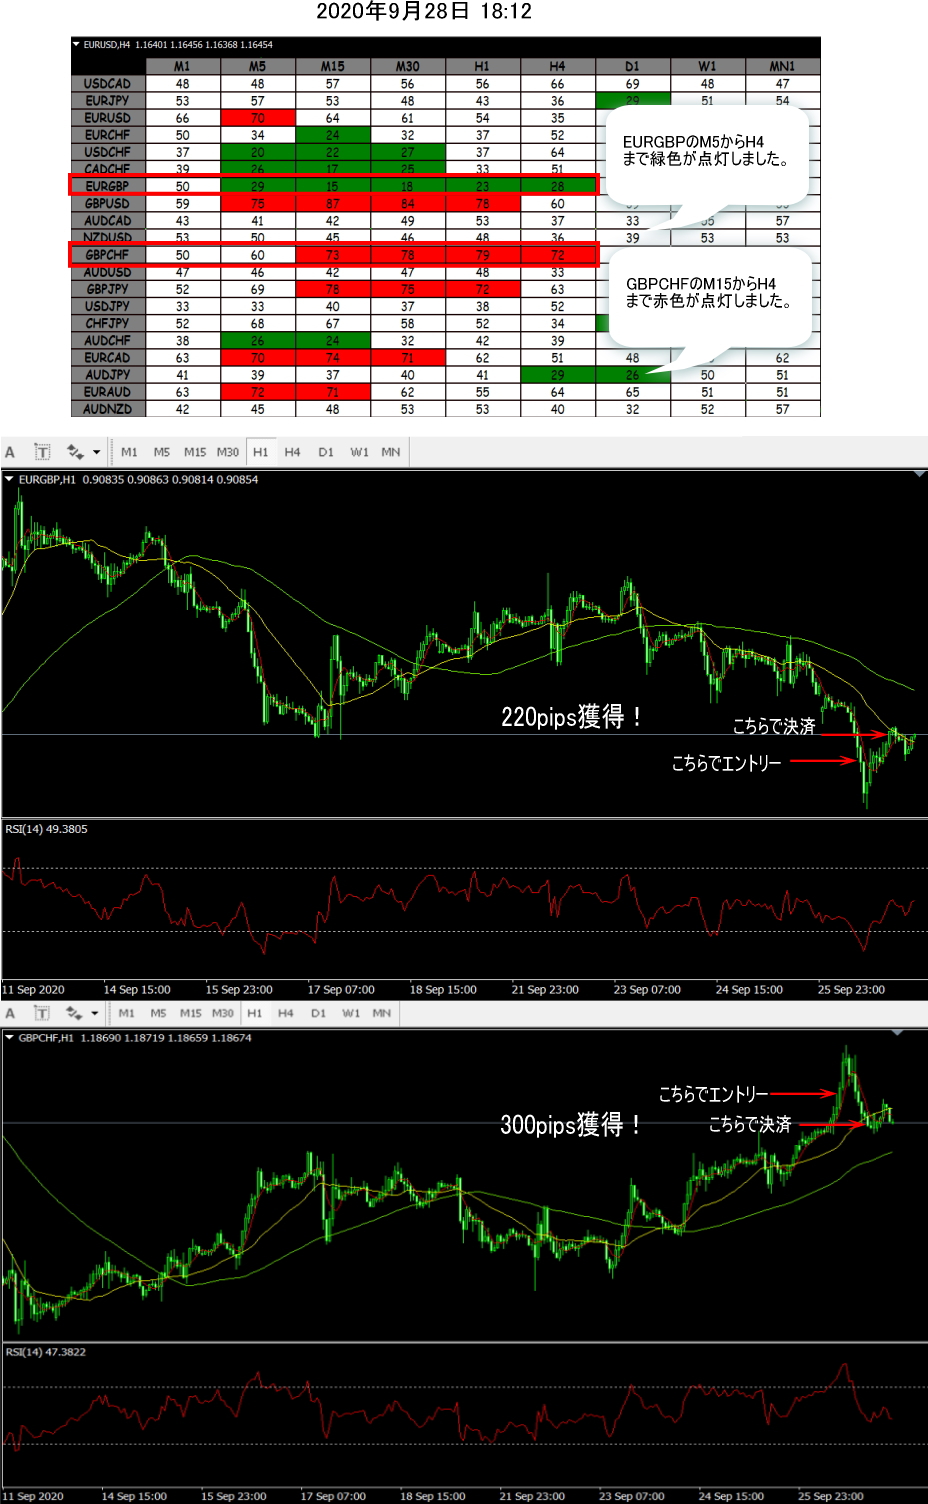
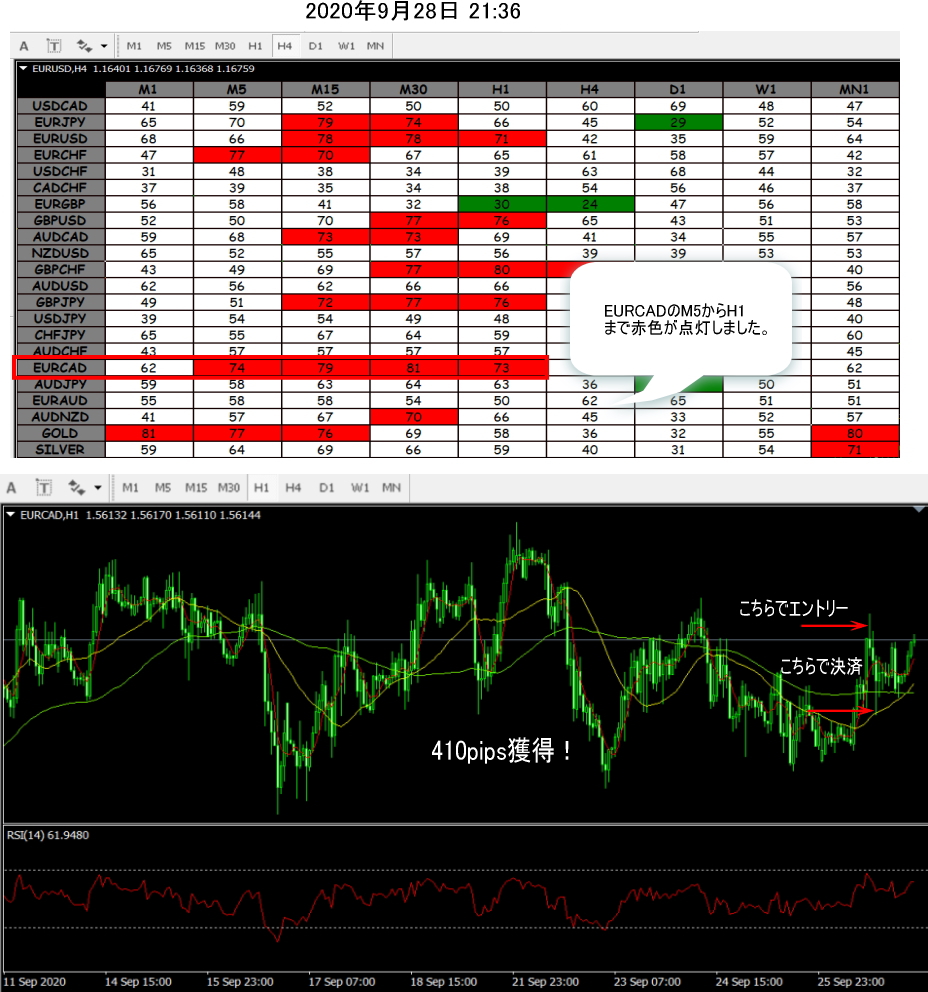
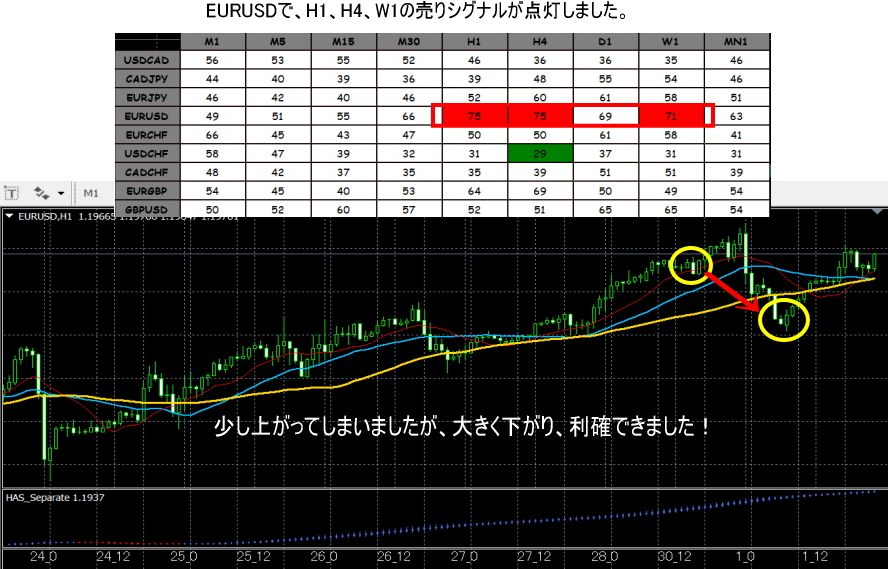
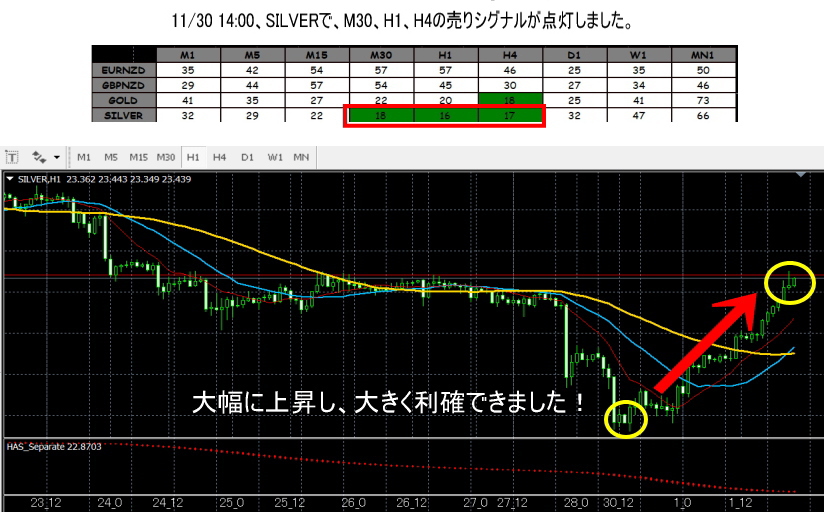
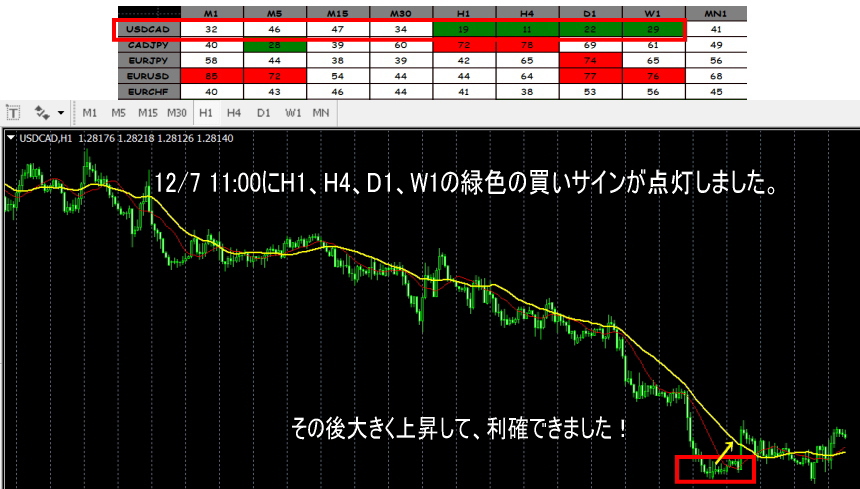
■ Trading example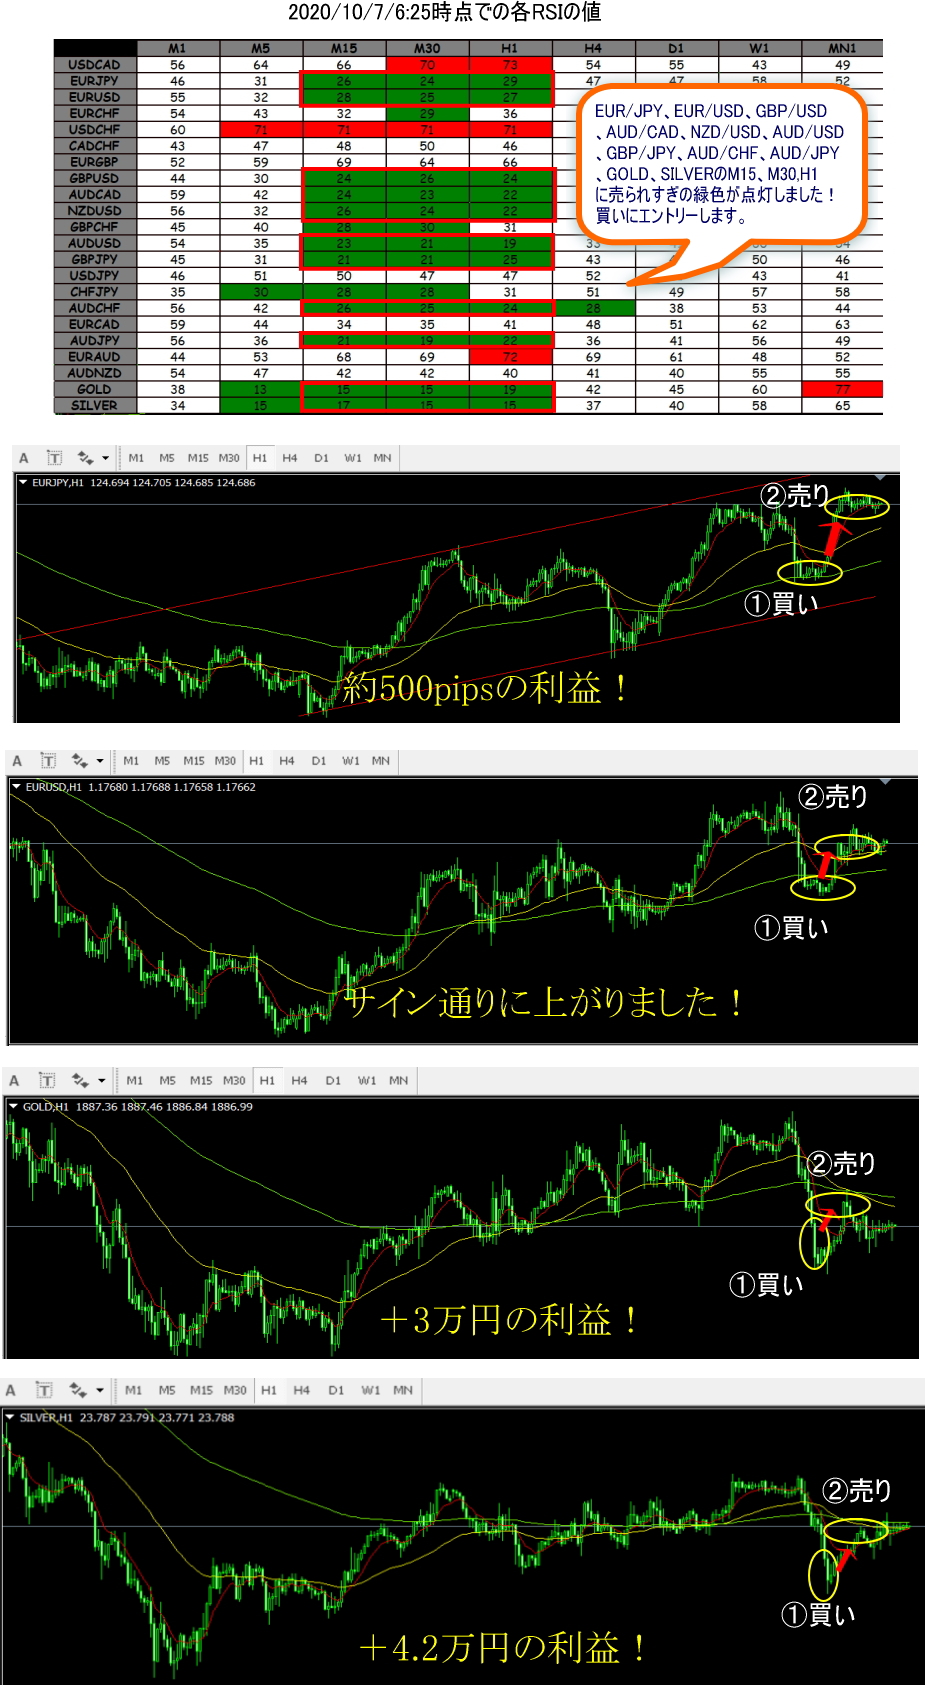
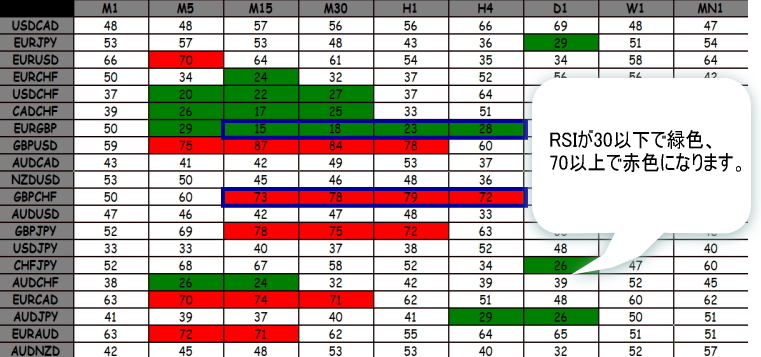
■ How to use the indicator
■ What is “RSI”?
“RSI” stands for Relative Strength Index. It is an indicator that shows whether the current market trend is leaning upward or downward. In simple terms, it quantifies “overbought” and “oversold” to teach you the strength of the market—a representative oscillator-type technical indicator. When should you buy (sell)?RSI is calculated for a certain period (commonly 14 days) by measuring how much the price fluctuates within that range, resulting in a value between 0% and 100%. Generally, entering the zone above 70% is considered “overbought,” and entering the zone below 30% is considered “oversold.” Then, if the market reverses after entering each zone, you consider selling in the overbought scenario and buying in the oversold scenario. It’s as simple as that, making it extremely easy to understand! Because of this clarity, it is a very popular indicator.
■ Features of the indicator
1. Supports all 28 currencies. 2. Displays the current RSI values from 1-minute to monthly charts, indicating whether the asset is in overbought or oversold state on the MT4 screen. If M15, M30, H1, H4 are all green or all red, there is a high possibility of a strong upward (downward) move ahead. 3. The RSI period defaults to 14 but can be changed. Chart and font sizes can also be adjusted. 4. Can be installed in MT4. 5. Install the indicator under “MQL4” and “Indicators.”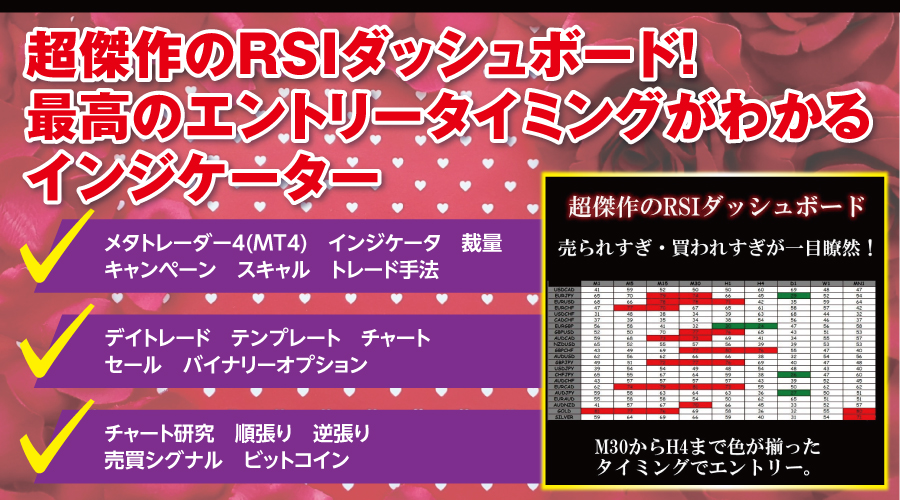
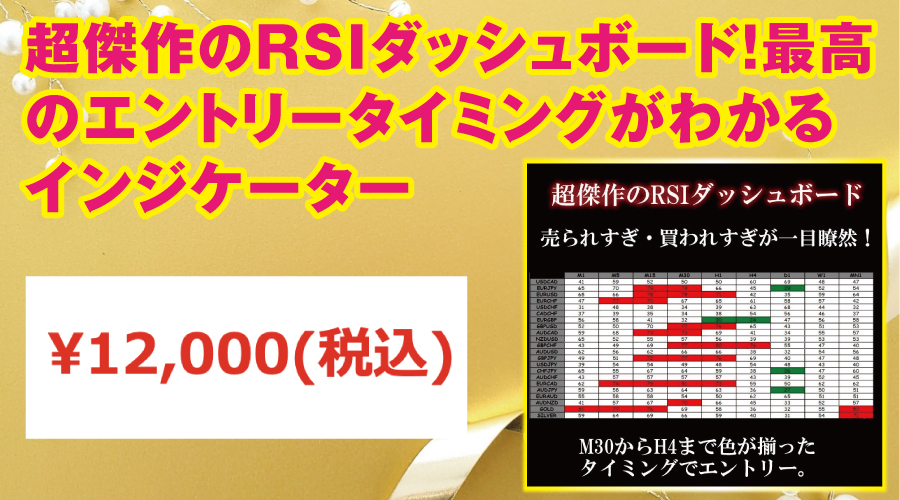
Purchase here!