
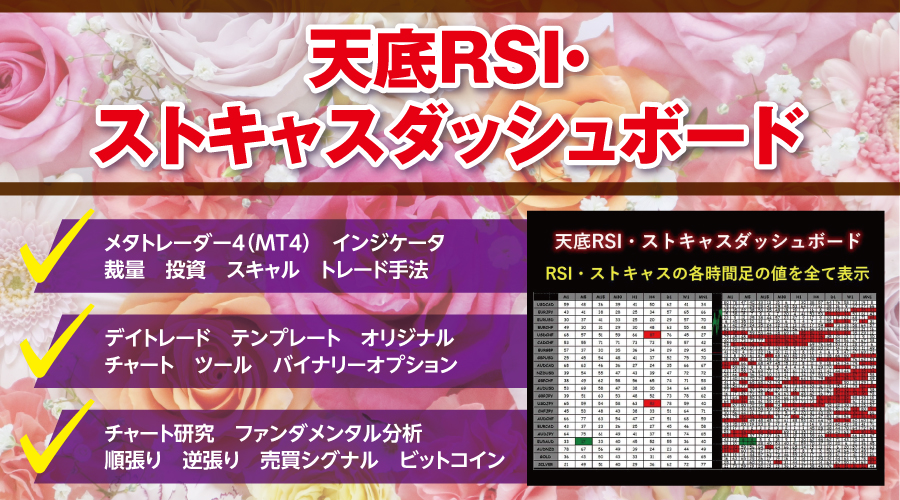
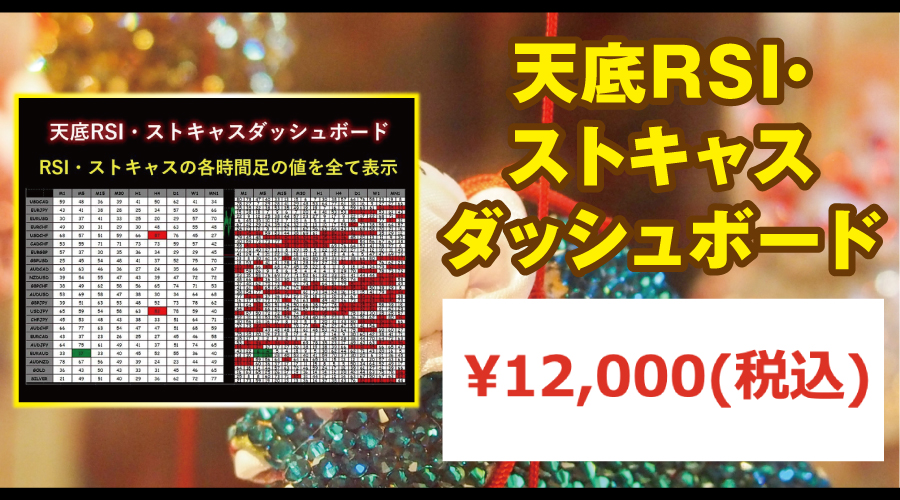
RSI, Stochastic Dashboard for Market Tops and Bottoms. You can see the highs and lows of each currency exchange rate. Displays all RSI and Stochastic values for each time frame.

Purchase here!
https://www.gogojungle.co.jp/tools/indicators/31784
The values of RSI and Stochastic for each timeframe are displayed in real time. This indicator makes the tops and bottoms of each currency’s market clearly visible at a glance.
■ How to Trade Using the Indicator
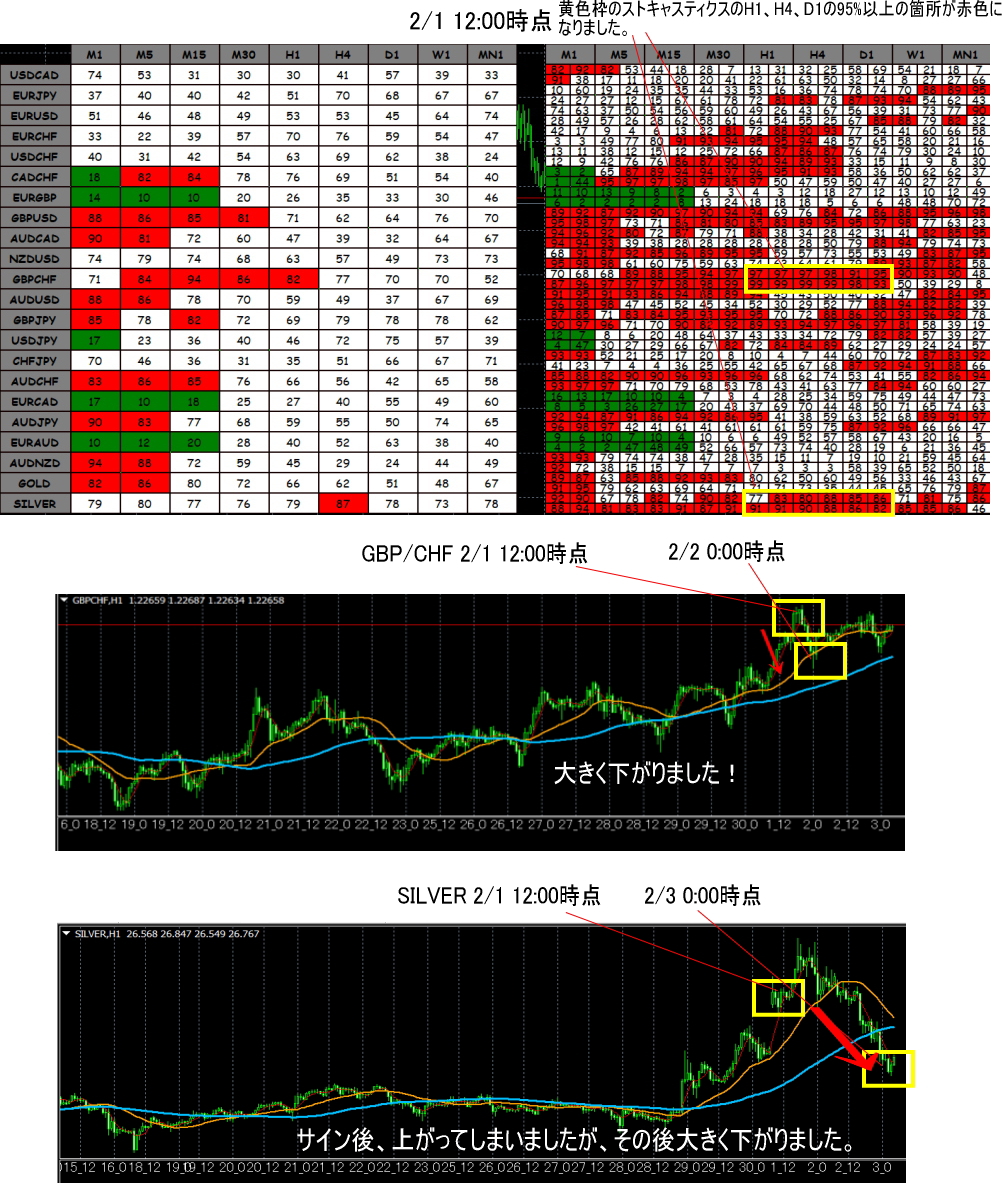
1) Enter when the RSI on the left shows H1, H4, and D1 at or below 20 and at or above 80. Alternatively, enter when the four values of the right-side Stochastic for H1, H4, and D1 are at or below 20 and at or above 80. Each timeframe’s four values are the four different time Stochastic values. 2) With RSI and Stochastic, you can determine if a currency is overbought or oversold. Enter at market tops and bottoms. Signals at H1 or higher are more reliable. 3) In both RSI and Stochastic, oversold is green and overbought is red. 4) Since you can check the market status of all currencies at once, it’s easy to select which currencies to trade.■ Indicator Performance
■ Features of the Indicator
1. Supports all currencies. 2. The indicator is recommended to be used with default settings. 3. Can be installed on MT4. 4. The periods of RSI and the four Stochastics can be changed individually. 5. Place the indicator in the “MQL4” and “Indicators” folders. After placing the Stoch_RSI_Extream.ex4 indicator in your product, please use it.
Purchase here!