

Today's (2/26) featured top entry! (ETHUSD)
❝Bottom of the skyChart (Reiwa version)❞
Today's (2/26) top recommended ironclad entry!
(ETHUSD)
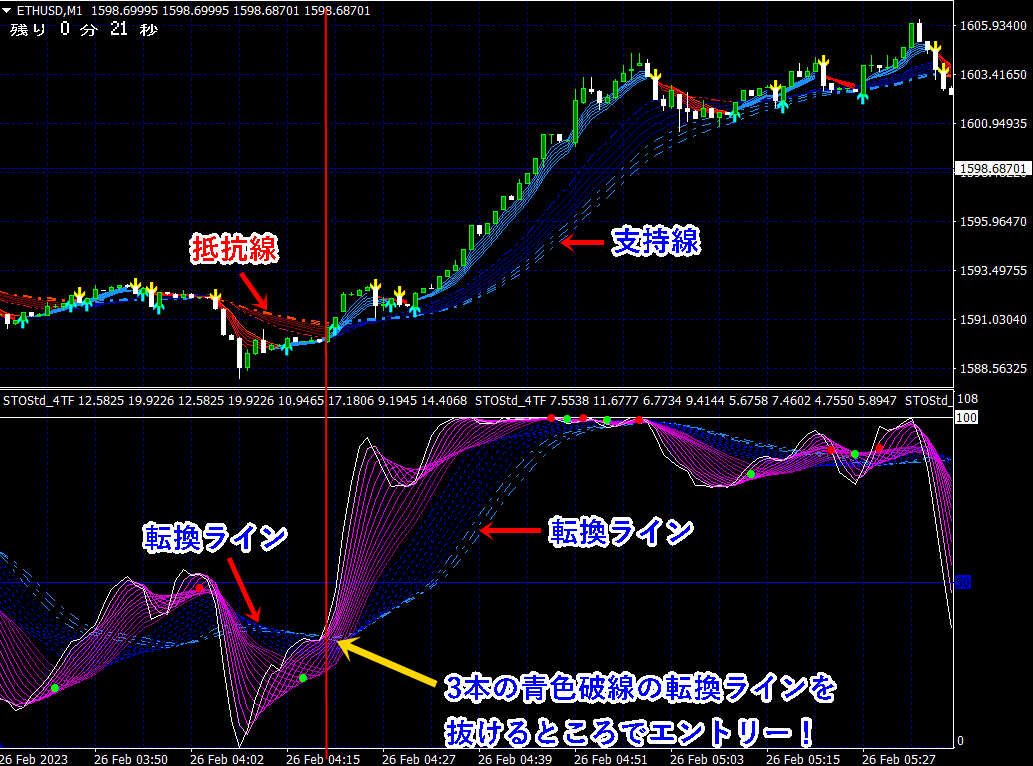
★Break above/below the conversion line to enter (click image to enlarge).
Among the many moving averages, in an uptrend,
there existsa support linethat effectively functions asa line with a certain widthas a supporting line.
Also, in a downtrend,
there exists a line of resistancethat effectively functions asa line with a certain widthas a resistance line.
In other words, if in an uptrend price breaks below the support line, the downtrend begins, and
in a downtrend, if price breaks above the resistance line without bouncing, an uptrend begins.
In other words,the support and resistance lines become the turning lines.
This concept also applies to indicators.
In the Tenki Chart (Reiwa version),not only moving averages, but
the indicator's curved bands alsofunction as clear display ofsupport/resistance = turning lines.
【Even just moving averages, this amazing!!】


