

Use of “Visualization Indicator” (Part 82)
“Visualization Indicator” usage (Part 82)82)
This time, with a slight twist,“Trend Line EX” how to use will be explained.
1. “Trend Line EX” how to use
This time, using a series of “visualization indicators,” we will show how to use theTrend Line EX.
mainly based on daily charts and longer-term timeframes such as 4-hour charts, how to construct trading strategies4 and so on. We will proceed in order.
(Note:February 2023 year 2 22 14:00)
2. “The Ultimate Inverse-Correlation Indicator” is introduced on the daily chart.
Sort the correlation coefficient column【Corr】 in descending order. This identifiesinverse correlation (large negative values) currency pairs. Look for pairs that are red (or in red tones) and show large volatility[DEV] and large absolute changes in rate[DIFf]▲ and▼, so they can be found quickly.
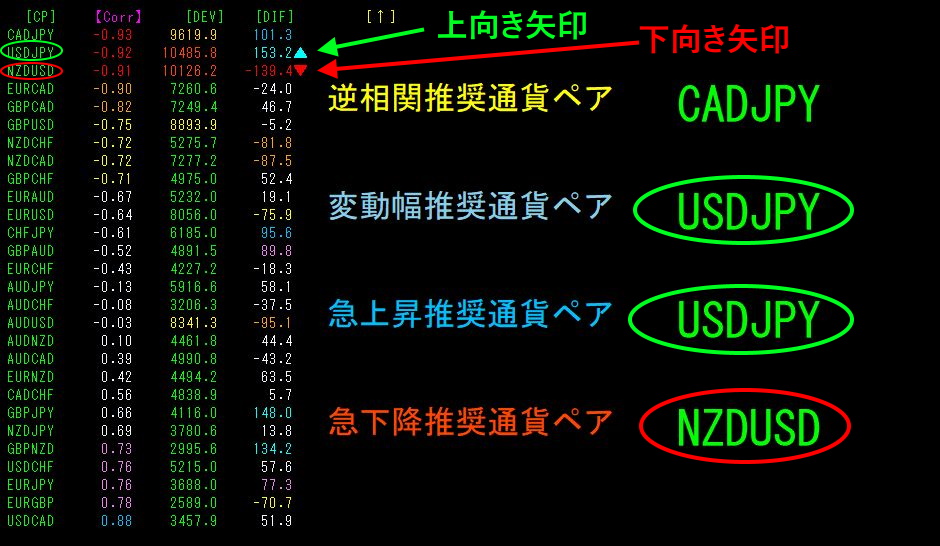
USDJPY and NZDUSD show large inverse correlation, and volatility is also high, with USDJPY as the rapid rise recommended pair and NZDUSD as the rapid decline recommended pair.
Therefore,USDJPY should be bought, should be sold for trading.NZDUSD
3. Try the “Heaven and Earth Search Indicator.”
The “Heaven and Earth Search Indicator” provides the position of the highs and lows on long timeframes and also informs about relative volatility. Think of it as a type of technical indicator.
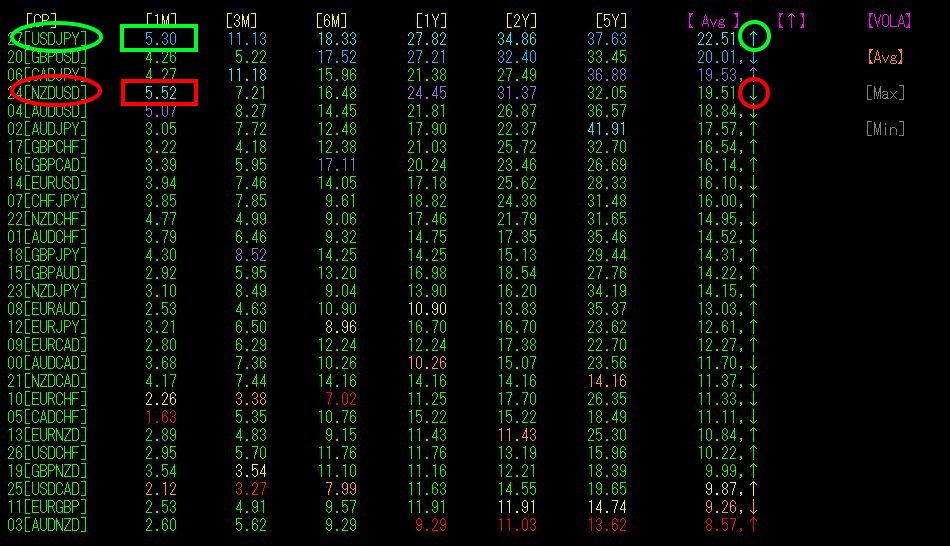
[Avg] sorts【VOLA】 in descending order, revealing that relative volatility is largest forUSDJPY rising falling
Why the relative volatility of NZDUSD and USDJPY is large is unknown, but from a technical indicator perspective, high volatility is indicated.
4.
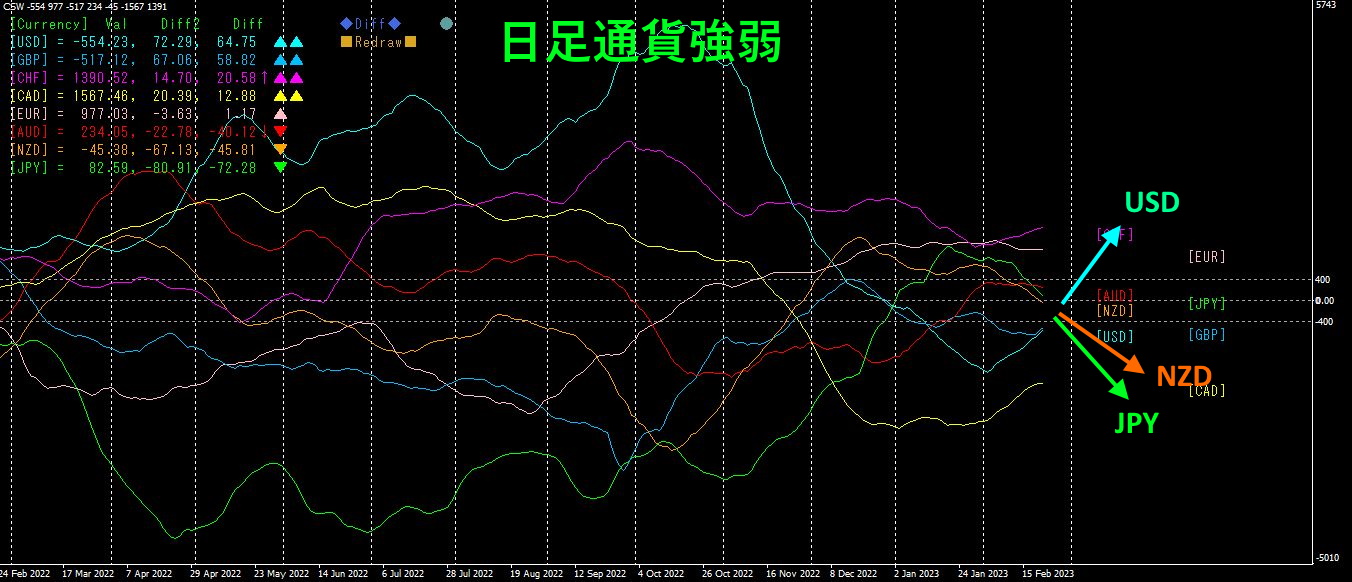
USD shows the strongest upward movement,JPY and trend downward. Viewed as waves, the overall pattern is currently in a convergence phase, likely to enter a dispersion phase next, widening up and down.
From the daily currency strength view, the conclusion is to buy and sell.
5. “Visualization Indicators” to understand movements compared to other currency pairs as waves.
“8CP Visualization Indicators edition.
Indicators are applied on the daily chart.
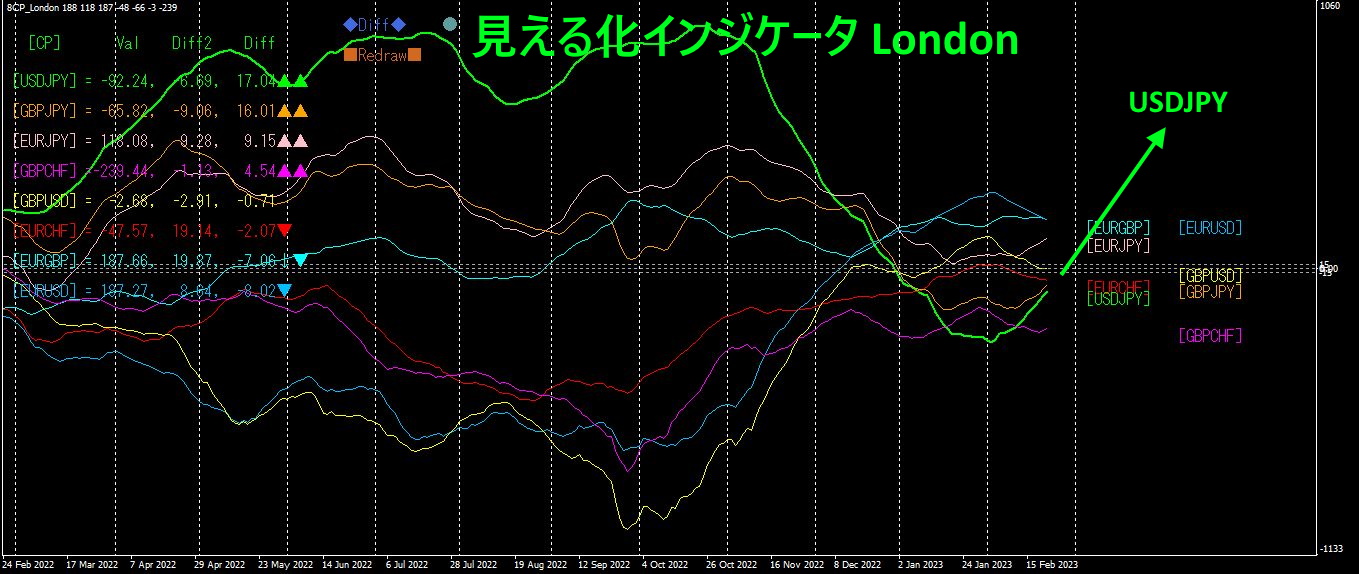
The green thick line represents. In the major wave, the line that previously declined has reversed and is now rising, which is visible as “visualized.”
The “8CP Visualization Indicator
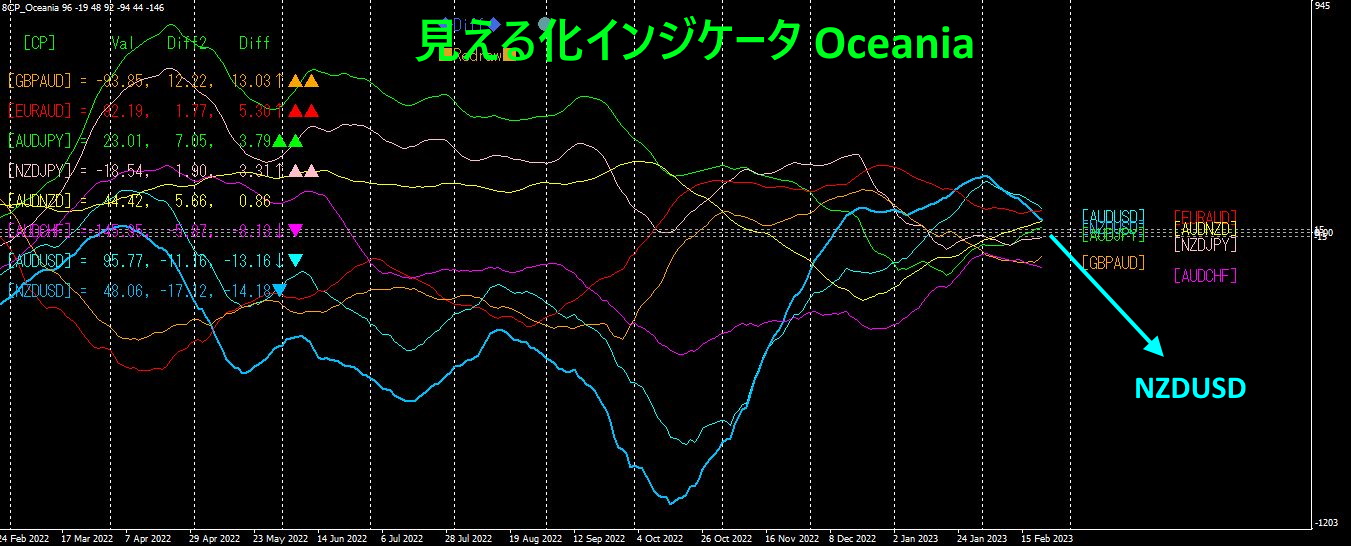
The light blue thick line on the graph is. This also shows that within a large wave, the previously rising line has reversed and is moving downward, as visualized.
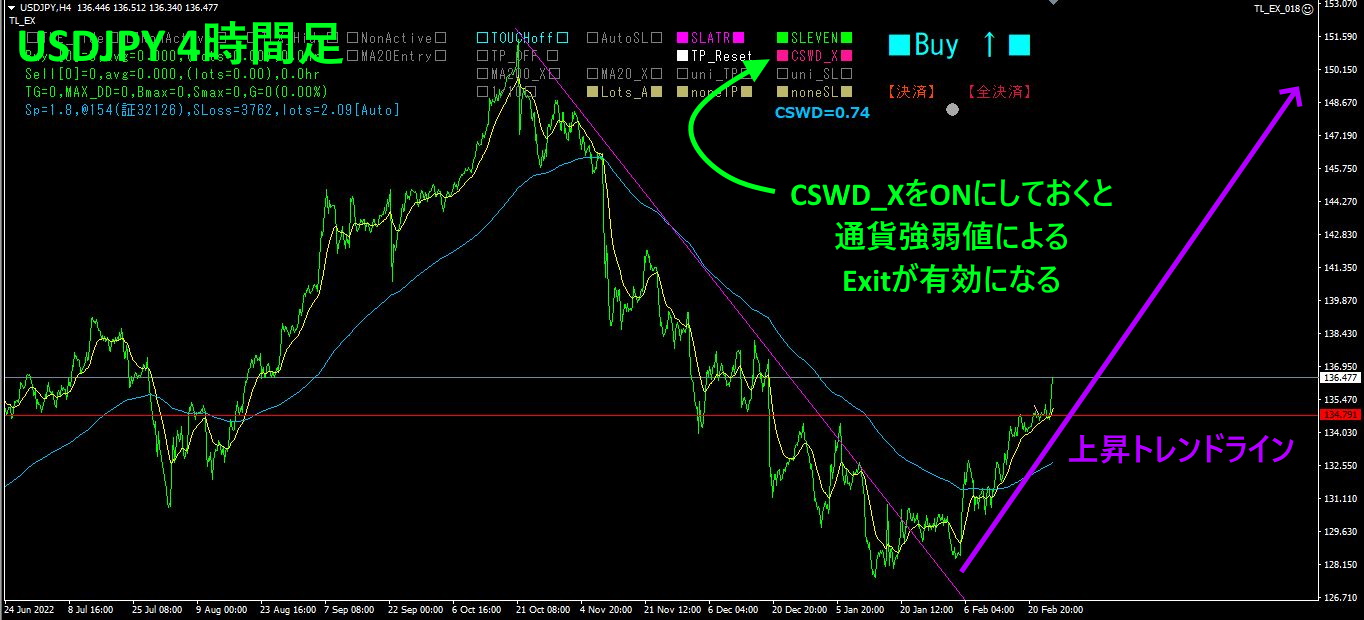
6. Apply “Trend Line EX” on the daily chart.
Now, the moment has arrived for the “Trend Line EX.”
First, from the daily chart of USDJPY,
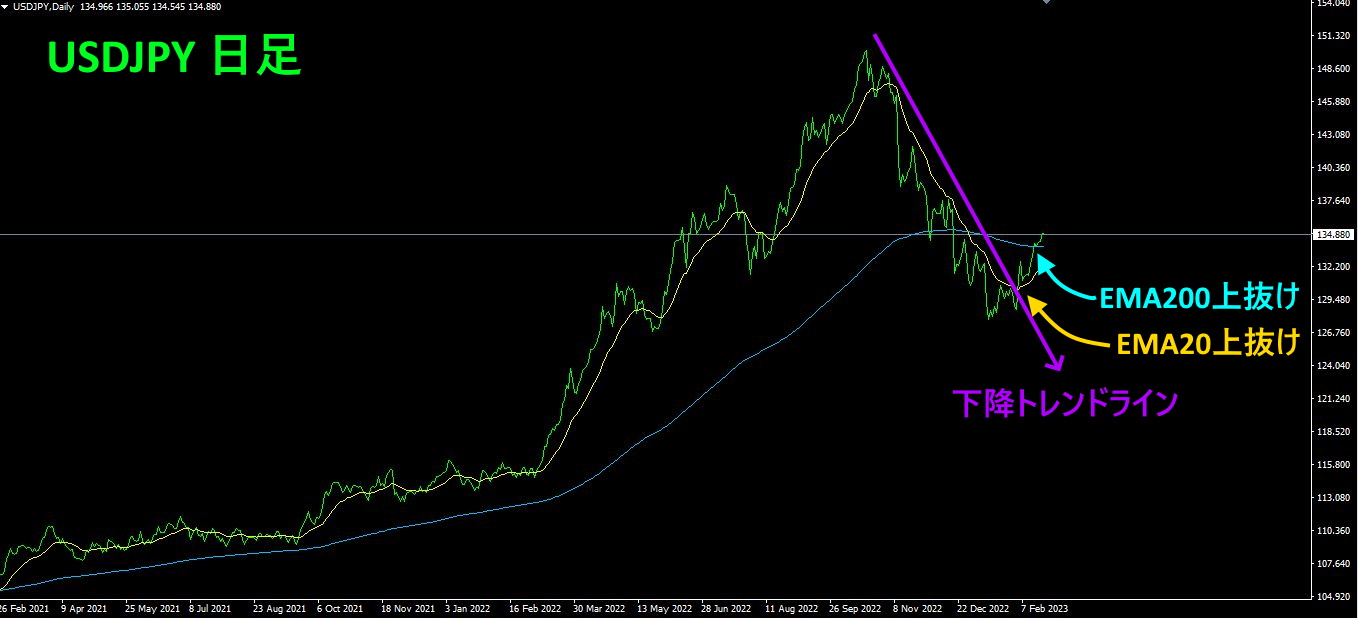
it has already broken above the downward trendline, has also broken above, has also broken above. It may be a bit late to enter, but in daily charts, a slight delay is acceptable.
You could enter now with a buy. For cautious traders, apply‑minute or other lower timeframe crossover buy” feature. This allows buying at a slightly cheaper price.
From the chart, it looks like the price is hitting resistance/support lines, so you can draw a horizontal trendline with and enter when the price breaks above this horizontal line.
edition. daily chart
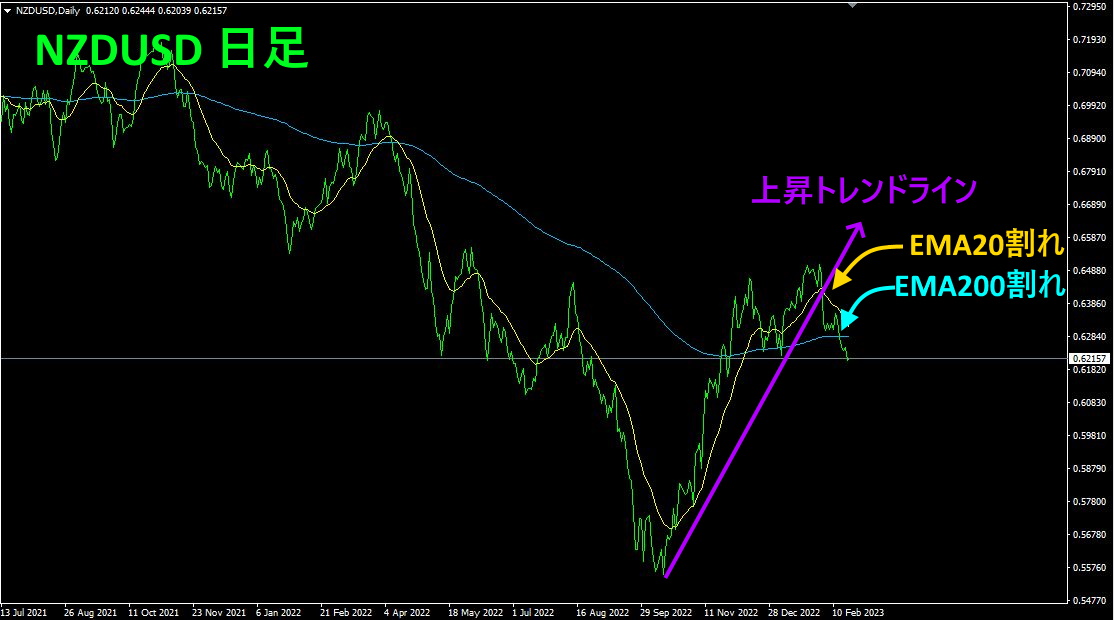
This chart looks like a mirror image of. It has already broken below the rising trendline, has broken below, has broken below. Entering now is slightly late (after breaking EMA200 by day 5), but this time we’ll look to sell.
If you are using “Trend Line EX,” you can apply it on a lower timeframe (for example 15-minute) and enter with the “MA20 break sell” function, or draw a horizontal trendline with and enter on a break below this line.
Now, let's try a short-term timeframe (USDJPY, 5-minute) with “Trend Line EX”.
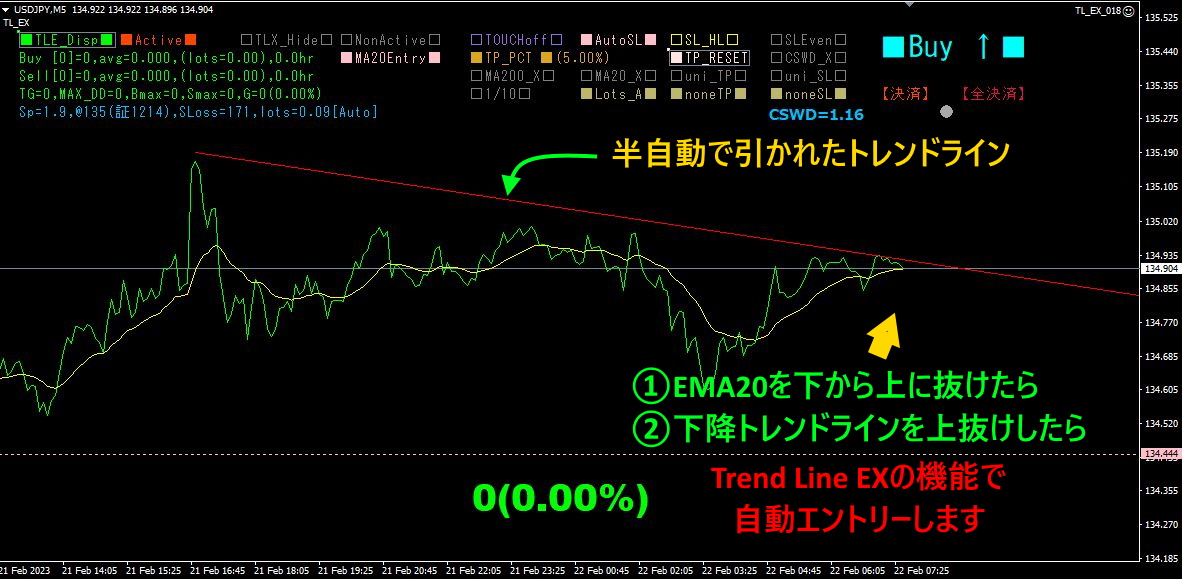
Then you just leave it alone. After entry, wait a bit, and once a rising trendline can be drawn, draw the trailing trendline for exit (TLX).
The subsequent chart
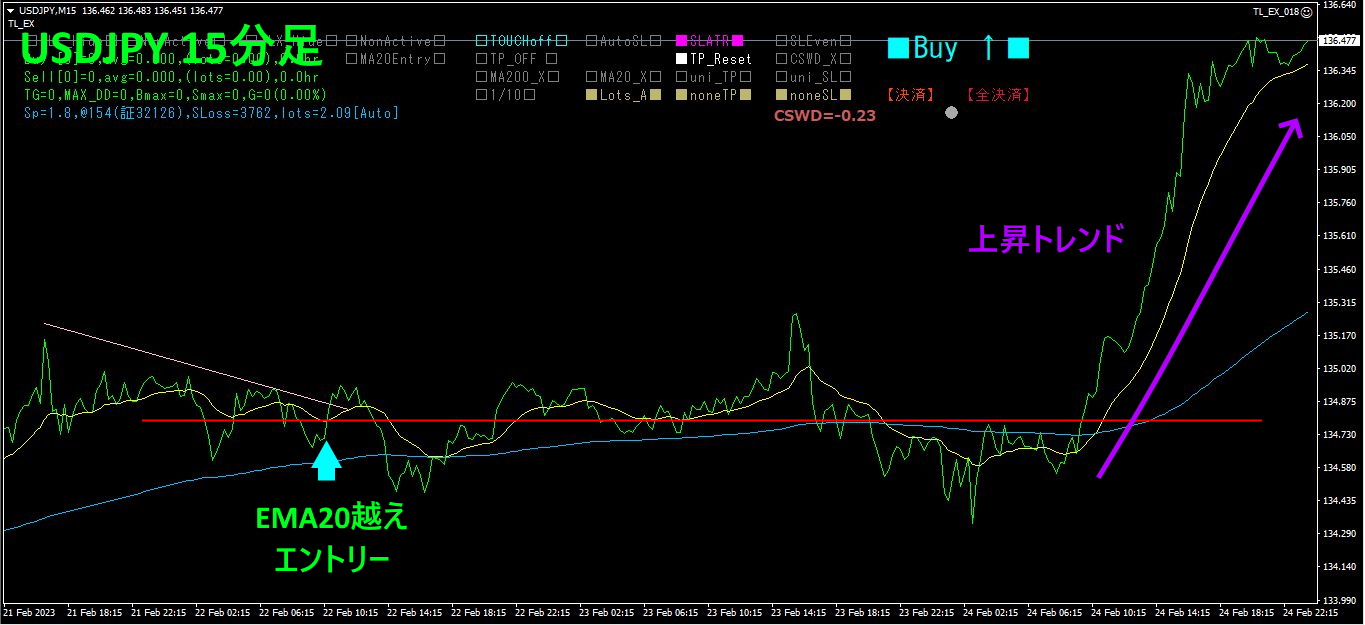
USDJPY 15-minute chart.
This is not a semi-automatic entry based on a trendline break, but rather an entry by breaking above EMA20, which automatically builds a long position. It then moves into a range for a while, but in line with the long-term chart’s trend analysis, it starts a kick upward.
Next, how far will it move? The daily chart shows considerable upside potential, so the range up to the next resistance/support line at would yield around, and up to the following resistance/support line at would yield about of movement.
In, draw the trailing exit line
At this point, you have a semi-automatic where the “Trend Line EX” operates as a “wait for fortune to come” state, so daily unrealized gains increase pleasantly, allowing you to practice a relaxed, classic form of trading.
※“”

https://www.gogojungle.co.jp/tools/indicators/42257
※Ultimate Inverse-Correlation Indicator
https://www.gogojungle.co.jp/tools/indicators/41656
※Heaven and Earth Search Indicator

https://www.gogojungle.co.jp/tools/indicators/42505
※ If you are interested in the “8C Currency Strength Visualization Indicator,” please refer to the following page.
MT4 edition https://www.gogojungle.co.jp/tools/indicators/39150
MT5 edition https://www.gogojungle.co.jp/tools/indicators/39159
【My listed products】


