Today (2/20) featured staple entry! (USDJPY)
❝TenkaChart (Reiwa Version)❞
Today (2/20)’s top recommended ironclad entry!
(USDJPY)
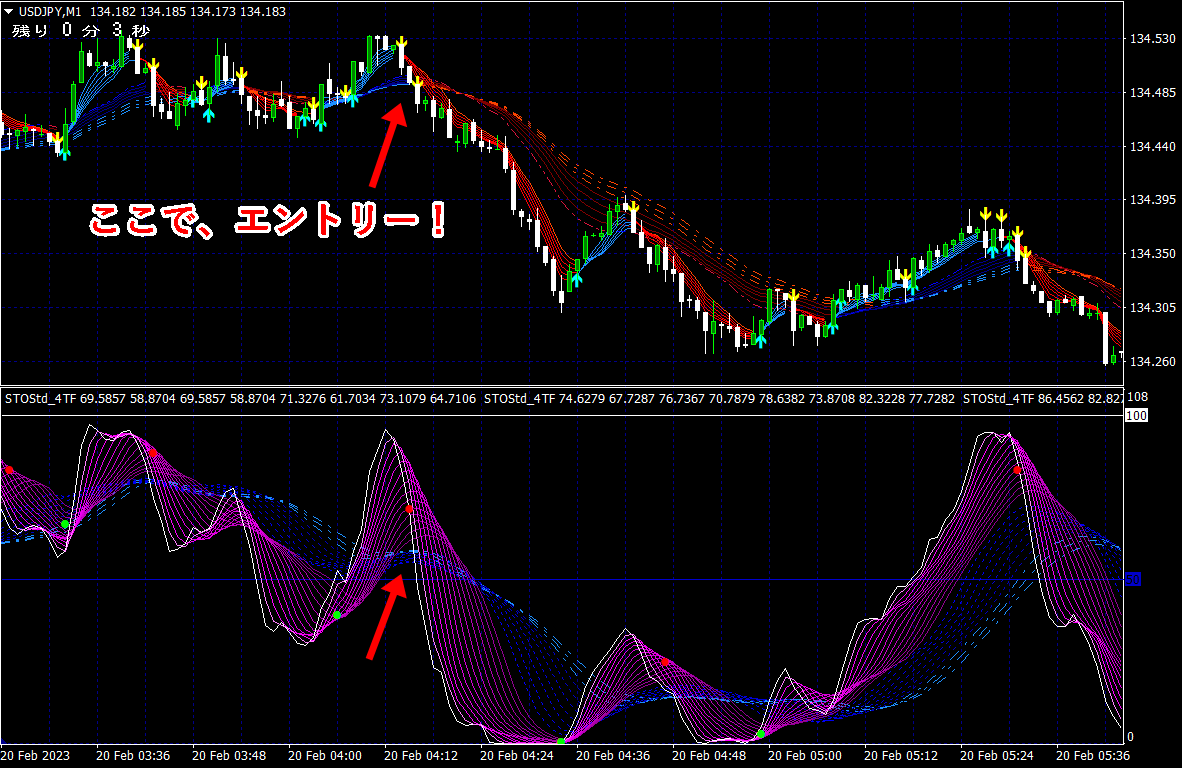
★ Moving average support/resistance lines (three-line broken) and
Indicator support/resistance lines (three-line broken) are
entered near the same time at breakout points!
Among the many moving averages, in an uptrend,
there are certain width lines that function effectively as a support line during pullbacks.
Also, in a downtrend,
there are width lines that function effectively as a resistance line during rebounds.
In other words, if in an uptrend the price breaks below the support line, a decline begins, and
in a downtrend if the price breaks above the resistance line without bouncing, an uptrend begins.
In short, the support and resistance lines become turning lines meaning they switch roles.
This idea also applies to indicators.
In Tenka Chart (Reiwa Version), not only moving averages but also
indicator curves are displayed clearly as lines that function as support/resistance—turning lines.

【Even with just moving averages, this is amazing!!】