

Today's (2/16) top recommended ironclad entry! (BTCUSD)
❝Top and Bottom Chart (Reiwa Edition)❞
Today (2/16)’s must-try ironclad entry! (BTCUSD)
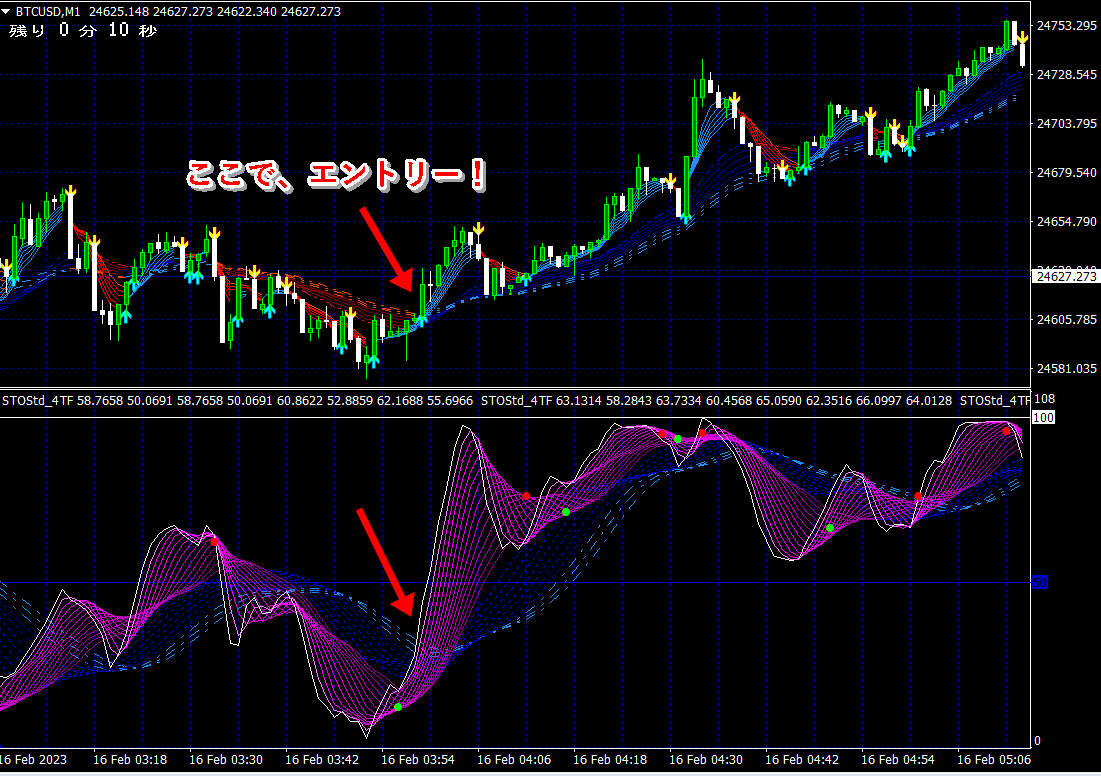
★ Moving average support/resistance lines (3 lines broken) and
Indicator support/resistance lines (3 lines broken) are
entered almost simultaneously at breakout and breakdown points!
Among the many moving averages, in an uptrend,
there is a certain width line that serves effectively as asupport line during pullbacks,and
in a downtrend,
there exists a certain width line that effectively serves as aresistance line for retracements.
In other words, if in an uptrend the price breaks below the support line, a downtrend begins, and
in a downtrend, if it breaks above the resistance line without bouncing, an uptrend begins.
In other words,the support and resistance lines become turning linesand vice versa.
This concept also applies to indicators.
In the Tenchi Chart (Reiwa Edition), not only moving averages, but alsothe indicator’s curves bands
display turning lines as support and resistance lines clearly and understandably.
【Tenchi Chart (Reiwa Edition)】

【Even with just moving averages, this is amazing!!】


