
Japanese Stocks Upper Wicks Stall! Is the rebound’s high limited?
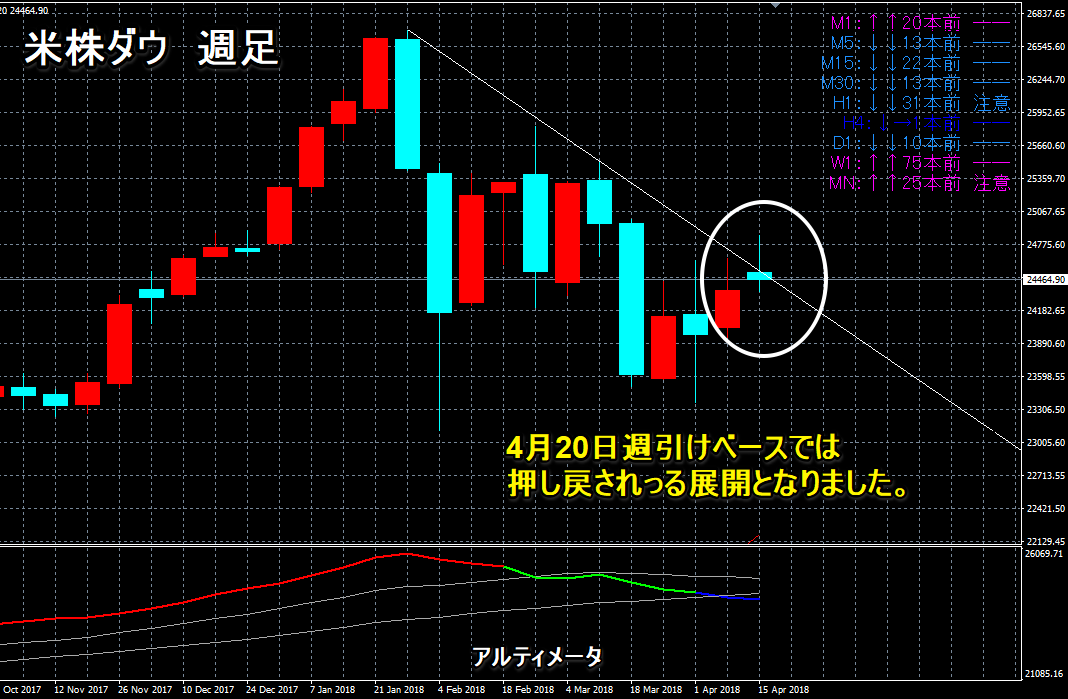
The Dow, the highlight of U.S. stocks, shows a weak rebound but on a daily basis has temporarily pierced above the upper resistance
The Nikkei Stock Average also moved to break through 22,000 yen.
However, both the U.S. and Japanese stock markets could not firmly clear the daily cloud, and on a weekly basis
the Dow was pushed back toward the upper resistance line again.
★Here is the previous article
It seems to become a point that will continue to be watched as an upper resistance.
This week may again be a week of attempting higher levels or a signal for a decline.
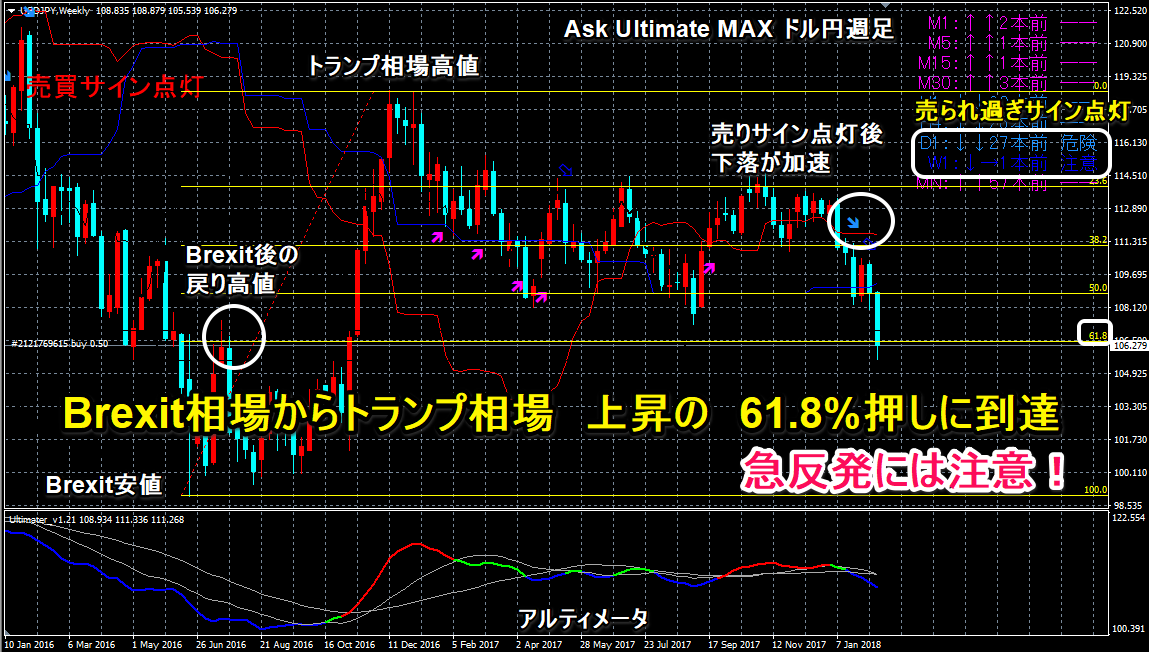
In the foreign exchange market, the U.S. 10-year yield rose, favoring dollar buying
and indicators in Europe have recently shown a downward trend and hints of an end to quantitative easing
leading to expectations to wait until the July meeting, so on a weekly basis
the market has been in a pattern of repeated long upper wicks, and since the dollar/yen has not been able to continue to rise
the cross yen is being pulled by the dollar-strengthening scenario.
Last week there were articles noting China's economic slowdown and the Shanghai Composite Index.
In 2015, the “Chinese Black Monday” turned the dollar/yen from around the 125 yen area into a downtrend
as a negative surprise, so given the current market environment, new
sparks could emerge that would cause a large market reaction.
★ Here is an indicator article predicting the Chinese Black Monday
“The crash signal suggested by indicator signs”
For the near term, domestic markets will be closed for Golden Week, so
exporters will place sell orders for the dollar/yen at the upper levels, making a continued rise unlikely
in such an environment. Also, if sell orders are not triggered during the holidays, when markets reopen
there have been many cases in the past where selling emerges, so although the market is moving toward a stable bottom,
we do not expect a continuation of the upside.
★ Irregularly, we have started a new series of Ask Indicator articles!
Market Compass Ask Indicator Strategy Delivery
★ In some parts, articles considered 105 yen or even 100 yen as possible lows, but
personally, I had warned about a sharp rebound scenario.
Market Compass, from the article posted February 18, 2018
★ The charts show“Ask Ultimate Shadow Warrior”for 15-minute Euro-Dollar day trading
from the ECB meeting to the U.S. jobs data. The price movement performed signals for buying and selling along with these events!
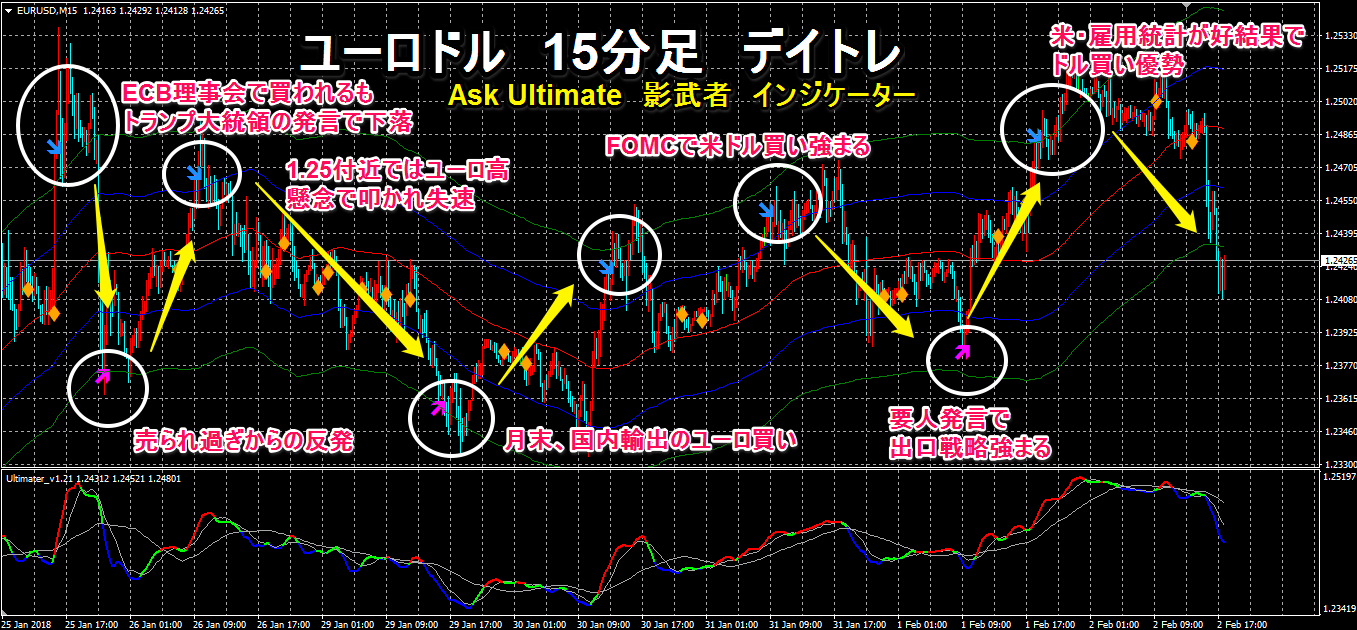
Click the image to enlarge! The indicators are“Ask Ultimate Shadow Warrior”/“Forex Squeeze” developed product
★ Both Ask Ultimate MAX/Shadow Warrior on 15-minute charts, etc.,
allowing precise trading with reduced risk!
For details, see below↓↓↓

★Strong for USD/JPY! Battle Zone Trade Giveaway Campaign!
● For each currency pair, entry and exit times are fixed!
● At each time period, participants rapidly switch in and out! Grasp the flow of a day’s market!
■ About summer and winter time zones ■ One week ■ One month ■ Yearly market trends
● Trading technique “Tokyo morning session is hot! This is the origin of the battle in the yen market!”
● Trading technique (long-term positions)
● Ask Ultimate MAX / Shadow Warrior bundle product
Additionally, a Battle Zone Trade indicator for the dollar-yen is being given as a gift!
“Forex Squeeze” trading technique Ask Ultimate MAX (long-term) / Shadow Warrior (short-term) indicator included
What is Battle Zone Trade?