

Today's top pick entry for today (2/11)! (ETHUSD)
“Tenchi (Tenchi-dai) Chart (Reiwa Version)”
Today (2/11)’s top recommended ironclad entry!
(ETHUSD)
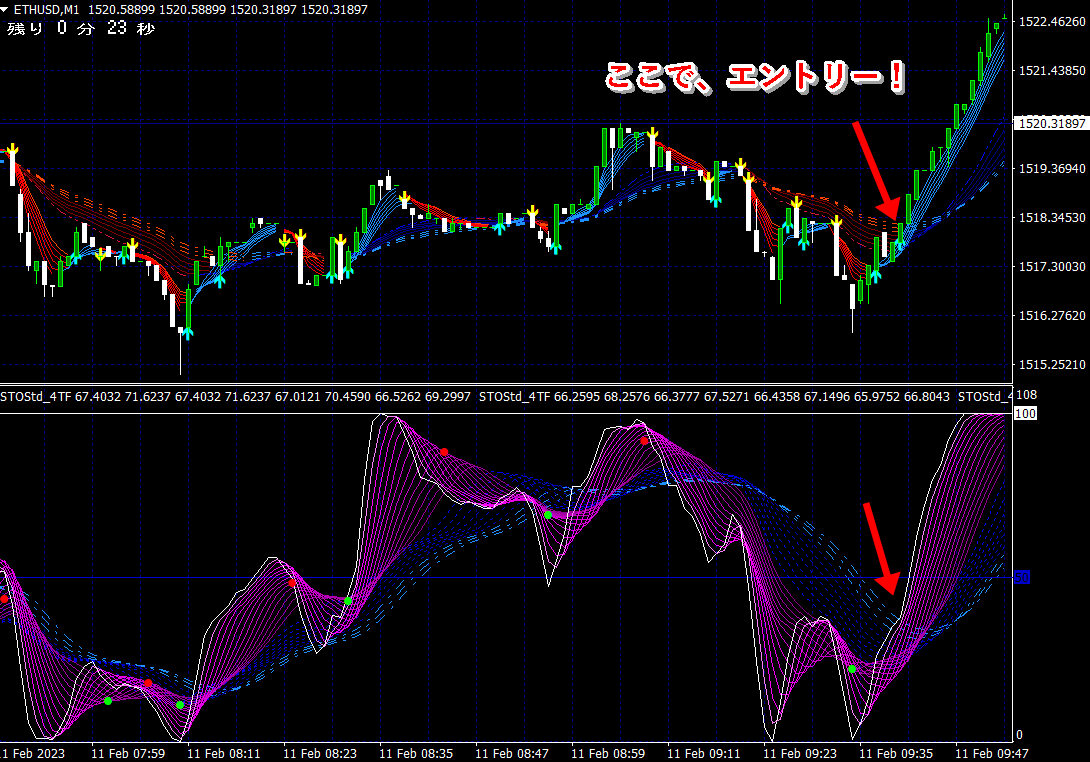
★ Support and resistance lines of moving averages (three-line breakout)
Support and resistance lines of the indicators (three-line breakout) are
entered almost simultaneously at breakout points!
Among the many moving averages, in an uptrend,
there are certain幅 lines that serve effectively as a bounce support lineas a support line.
Also, in a downtrend,
there are幅 lines that function effectively as a back-resistance line(resistance line).There exists a certain width line that serves this purpose.
In other words, if in an uptrend the price breaks below the support line without stopping, a downtrend begins, and
if in a downtrend it breaks above the resistance line without being bounced back, an uptrend begins.
In short,the support and resistance lines become turning lines.
This concept also applies to indicators.
In Tenchi Chart (Reiwa Version), not only moving averages but also the indicator curves
are displayed clearly as lines that function as support and resistance—i.e., turning lines.
【Tenchi Chart (Reiwa Version)】

【Even with just moving averages, this is amazing!!】


