

Market analysis method using Primo
Thank you for your hard work!
This is Nobushi!
Today in Tokyo it's snowing, isn’t it...!
It has been snowing since this morning, so it is having a major impact on commuting and going to school.
I was born and raised in a snowy country, so
I should be resistant to snow, but since I’ve lived here for a long time, my tolerance to snow may be gradually decreasing.
Now, this time I will explain the market analysis using Primo, which I updated recently.
With this update, the “currency strength/weakness value” is visualized with a line,
and you can now look back over time to see its movements!
A buy/sell signal appears when the gap in this strength/weakness value is large and other conditions are met, but I hope this will be helpful as a reference when you’re looking for entry points yourself.
The following is today’s USD/JPY 5-minute chart
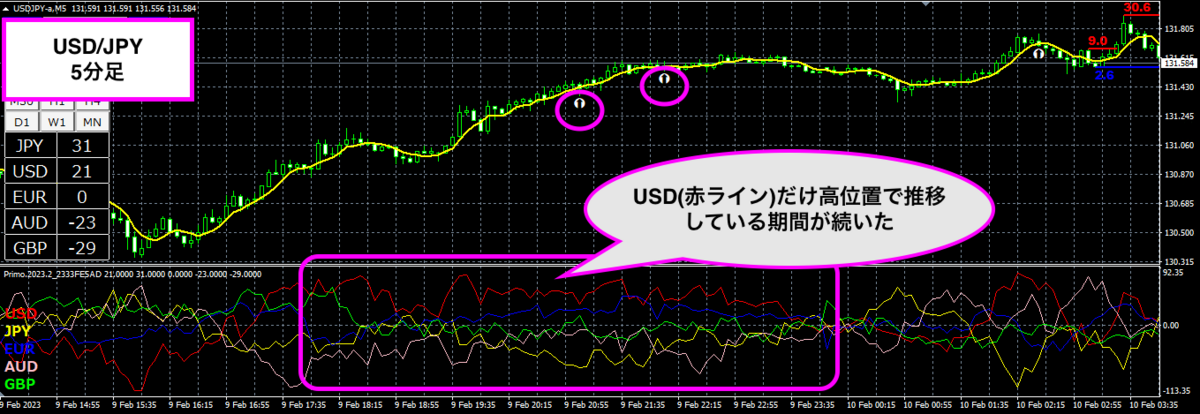
In the area enclosed by the purple border in the sub-window,
the value of the US dollar remained the strongest for a period of time.
This is what you could call the “US dollar dominates” time.
On the other hand, the yellow line (JPY) and the pink line (AUD) were moving at low levels
In other words, assets that had been allocated to the Japanese yen and the Australian dollar were flowing into the US dollar.
Naturally, this means a policy of buying USD/JPY and selling AUD/USD.
Basically, the greater the strength/weakness gap becomes,
the stronger the trend, so the entry point tolerance isn’t that important.
In fact, on the chart above, it’s likely profitable no matter where you enter within the trend.
With Primo signals, the trend is displayed conservatively in the latter part of the trend, but
those who can read the chart might have entered a bit earlier.
First, on the 5-minute chart, try to find such large strength/weakness gaps in the sub-window.
However, on a 5-minute chart, the trend time is short, so be quick to exit as well!
Primo plans to add many more features in the future!
I believe currency strength/weakness will govern trading, so
we aim to create indicators that can leverage them!
The update information is explained at the bottom of the site below!