

Today (2/9) 's top recommended鉄板 entry! (BTCUSD)
❝天底チャート(令和版)❞
Today (2/9)’s Featured Ironclad Entry!
(BTCUSD)
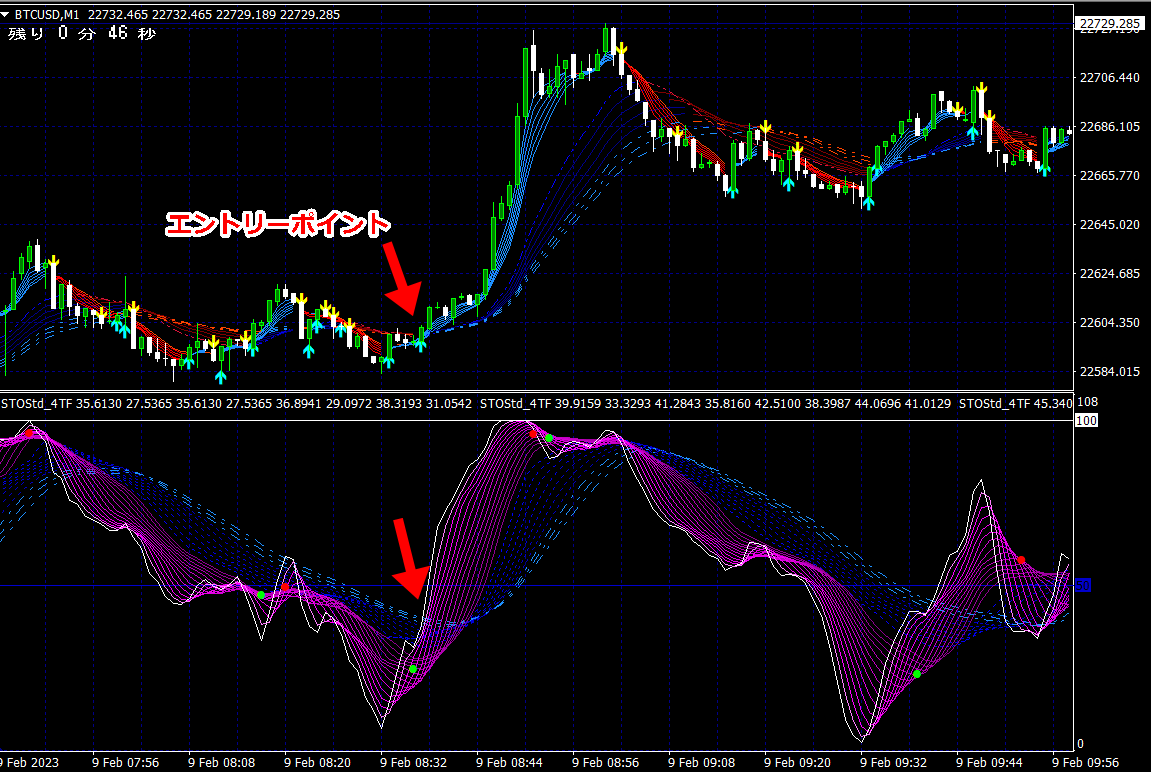
★ Moving average support/resistance (3-line break) and
Indicator support/resistance (3-line break) lines
enter near the points where it breaks up or down at almost the same time!
Among the many moving averages, in an uptrend,
there are certain幅 lines that serve effectively as a pullback support line (support line) with a specific width.
Also, in a downtrend,
there are certain幅 lines that serve effectively as a retracement resistance line (resistance line) of a fixed width.
In other words, if in an uptrend the price breaks below the support line, a decline begins, and
in a downtrend if it crosses above the resistance line without being bounced, an uptrend begins.
In short,the support and resistance lines become turning lines.
This concept also applies to indicators.
In the Tenjo Chart (Reiwa Edition), not only moving averagesbut also the curves of indicators
display lines that clearly show support/resistance = turning lines in a clear way.

【Even with just moving averages this amazing!!】


