
【Free!】XAUUSD Is this decline not a trend reversal?
Hello, good evening.
I am the President.
I would like to give a rough explanation of XAUUSD.
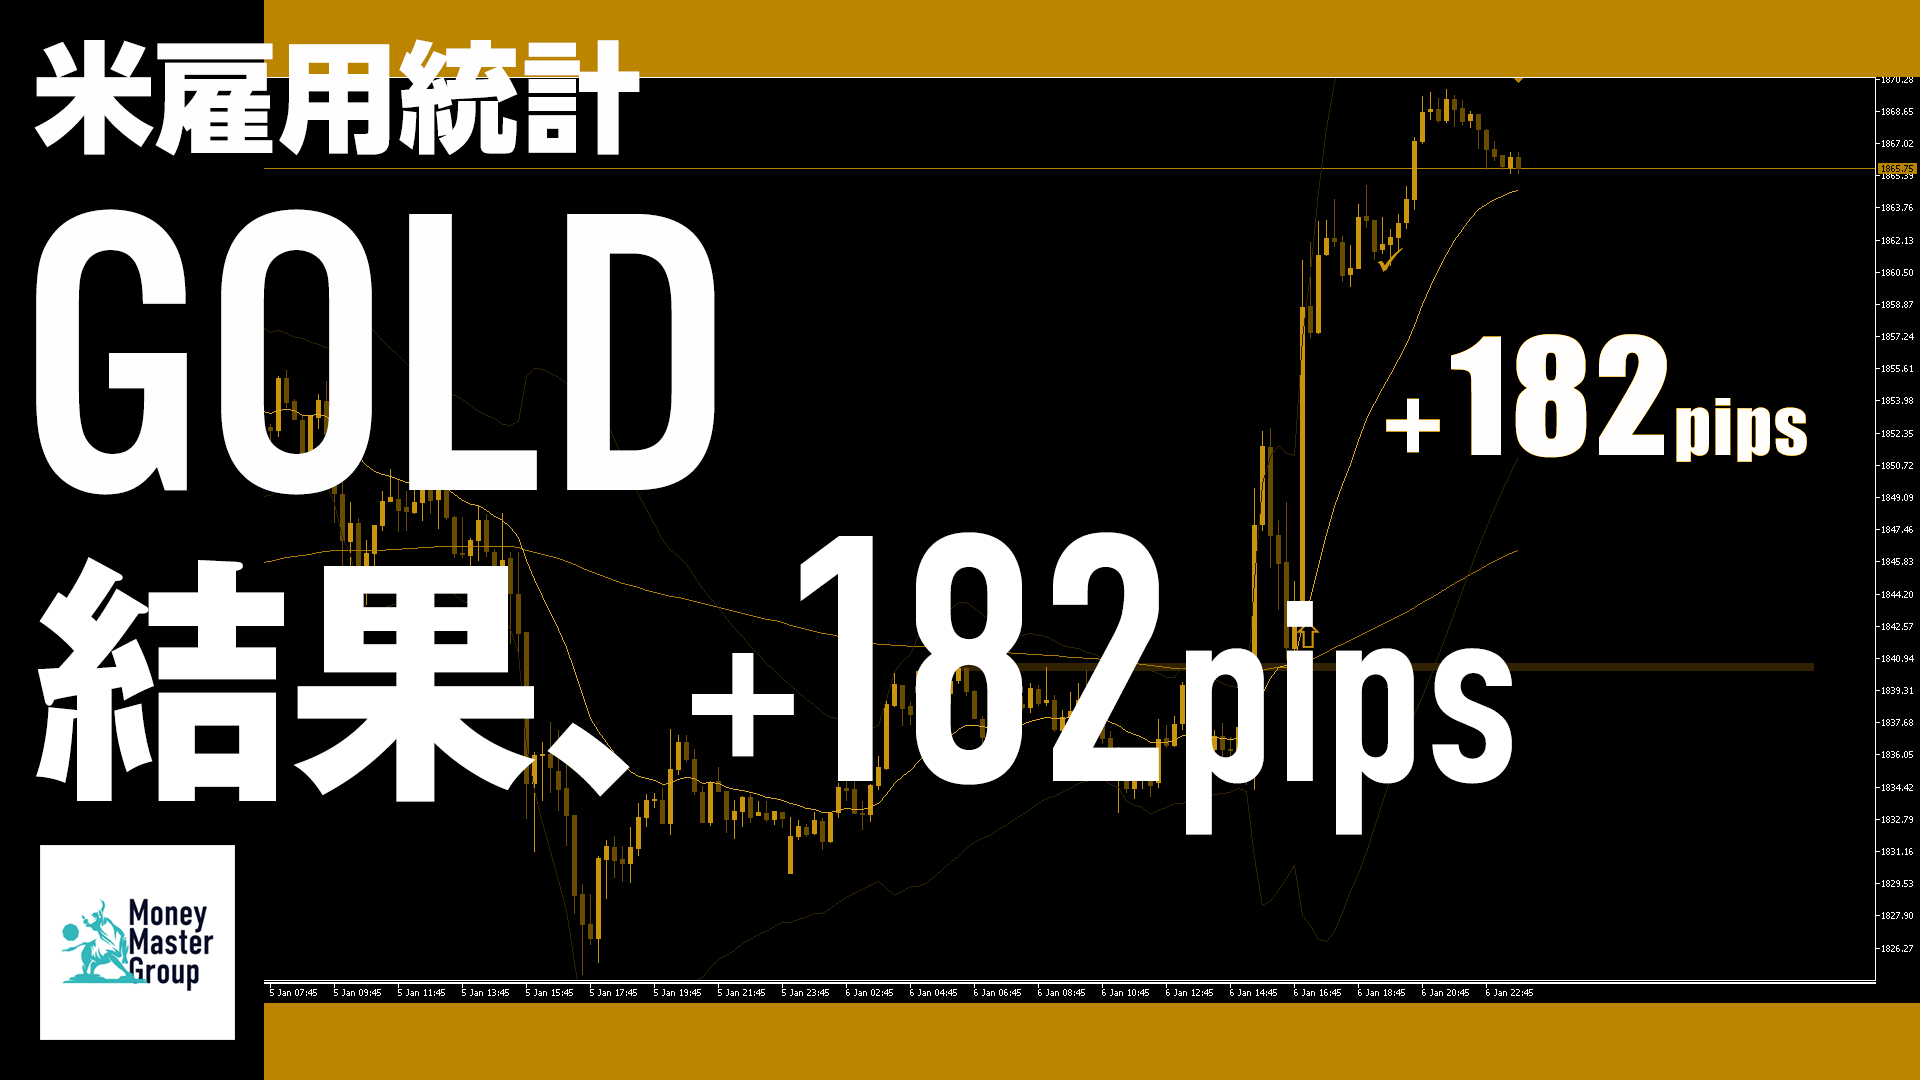
Last Friday's US employment data was a positive surprise, so
there was a sizable correction and new selling (short-term players).
For those with shorter time frames, I think it can be viewed as a short-term trend reversal.
Perhaps this is appropriate to regard as such.

First, from a technical standpoint
the round-number at 1,950 served as a target for profit-taking, and many were cashing in.
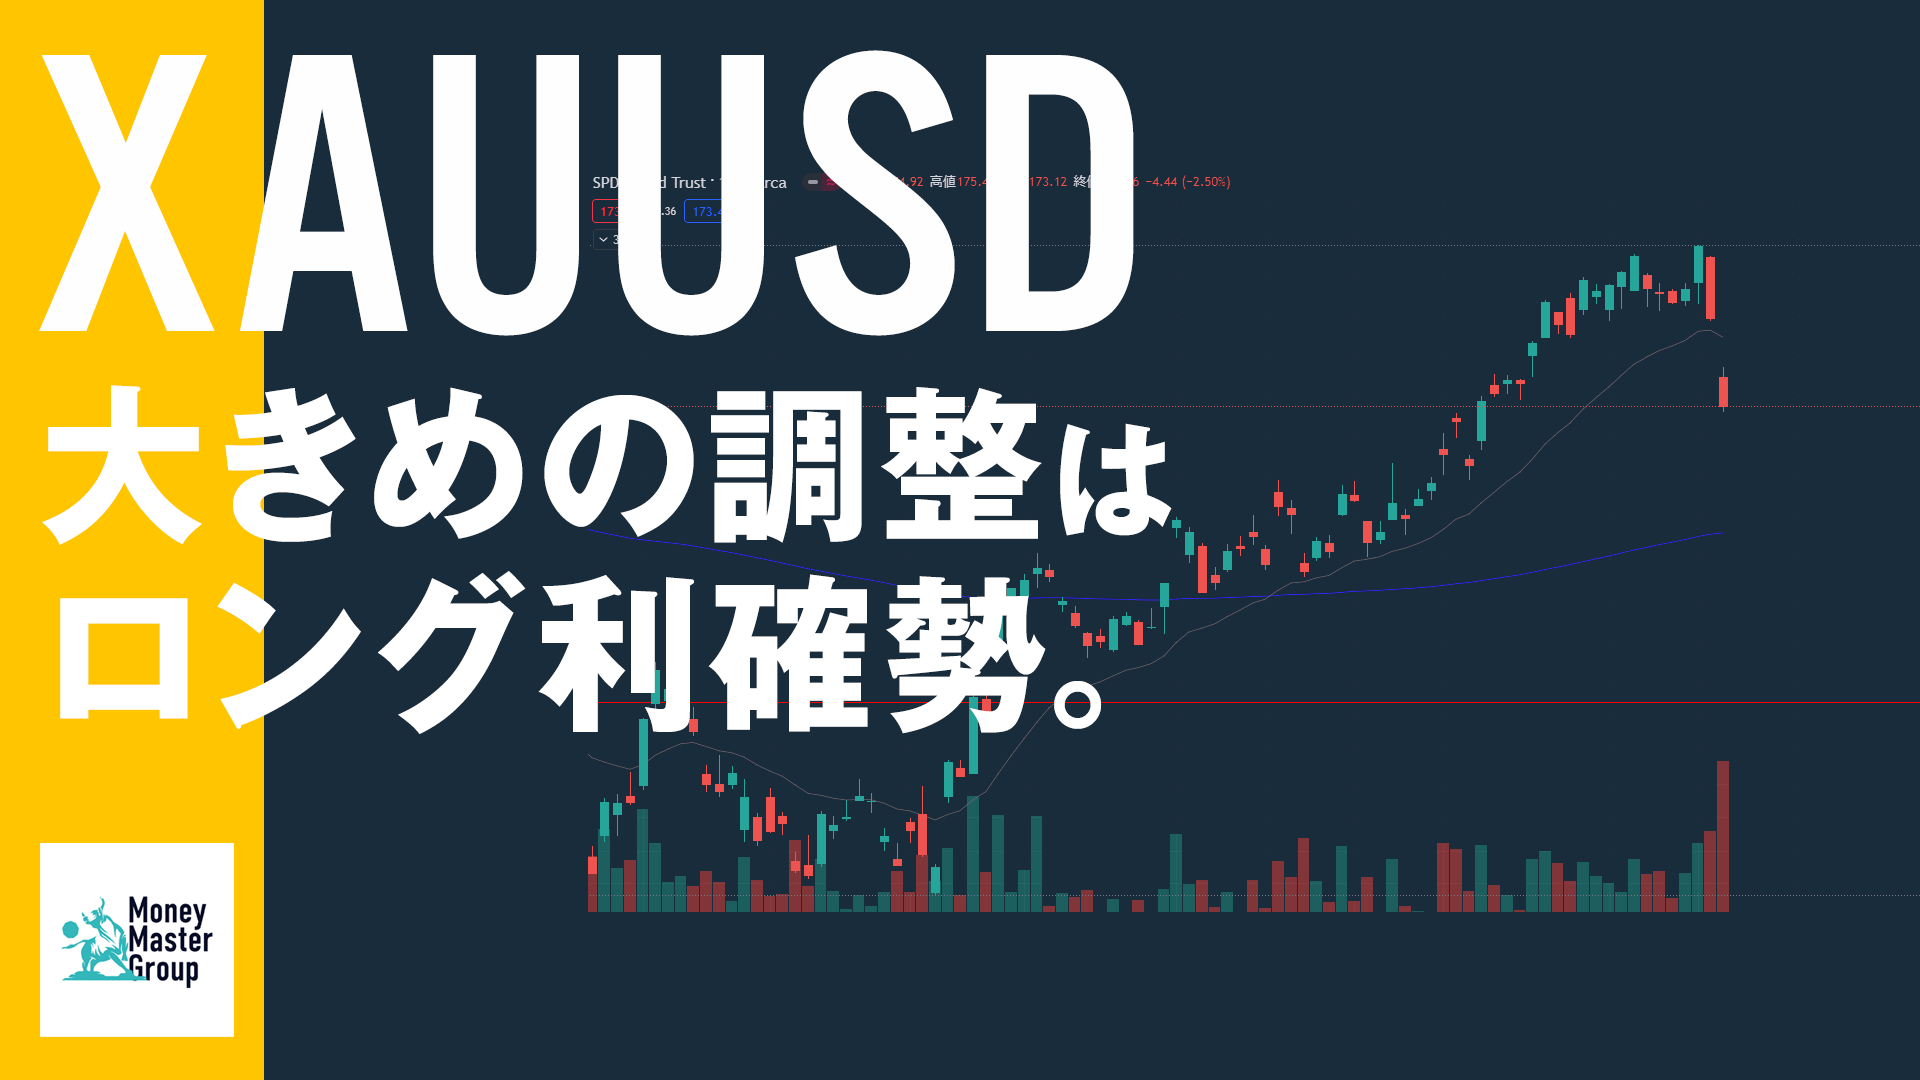
Also, below is the ETF daily chart,
which shows a decline accompanied by volume,
and the large volume is mainly due to shorting by short-term players,
and as I mentioned earlier, the target at 1,950 and the positive surprise of US employment data.

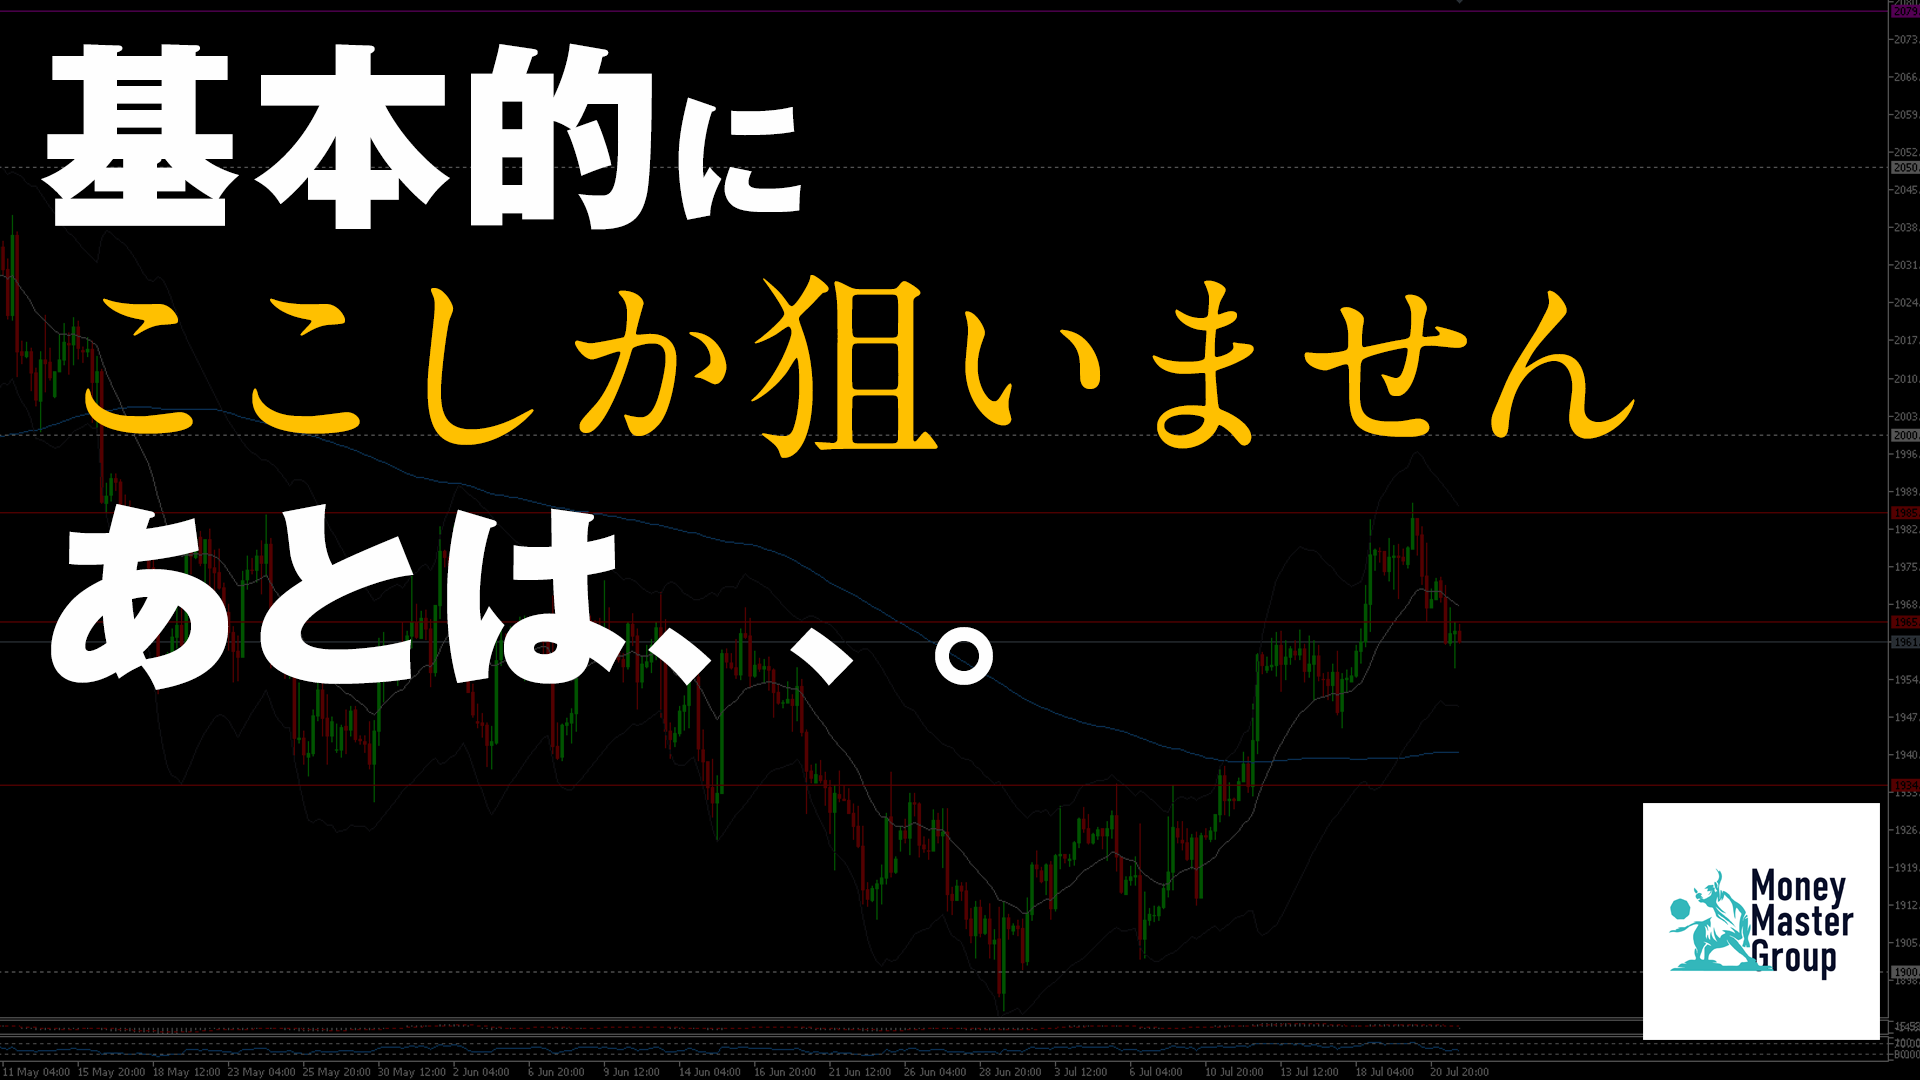
Next, looking ahead at the potential price action of XAUUSD,
two patterns can be considered.
* Headlines such as the Fed policy and US economic indicators are to be watched closely.
・XAUUSD Chart Analysis ①
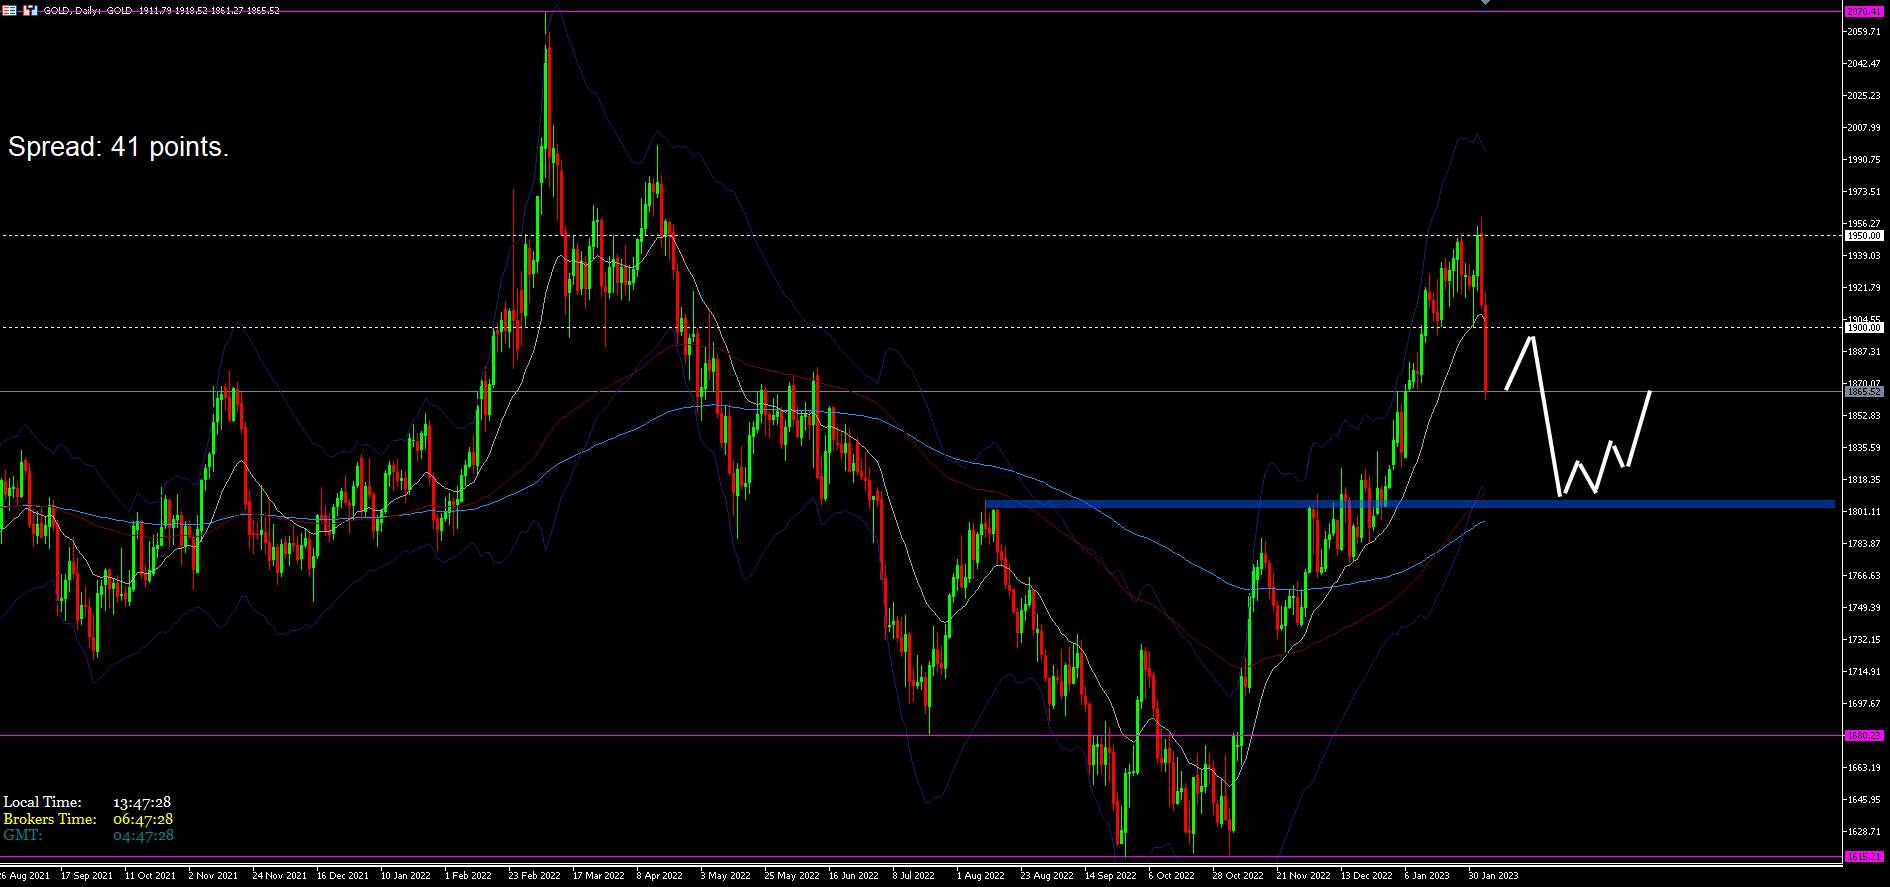
・XAUUSD Chart Analysis ②

Furthermore, XAUUSD and the USD/JPY maintain a clean negative correlation as well.
However, as shown in the image below,
the USD/JPY is not rising with as much volume as XAUUSD, so
around the yellow circle (roughly 134.00), a retracement or a period of consolidation if there is little news would be the theory.
For those with shorter time frames, I think it can be viewed as a short-term trend reversal.
Isn't that right?
・USD/JPY Daily

Now, or rather since last year in particular,
the market is highly sensitive to economic indicators and remarks from important figures,
so until the direction of the Fed's policy becomes clear,
the market will continue to react to headlines and US economic indicators with optimism and pessimism.
XAUUSD remains biased to the upside.
Well then.