Today (1/25) featured hot entry! (BTCUSD)
❝天底チャート(令和版)❞
Today (1/25)’s top recommended ironclad entry!
(BTCUSD)
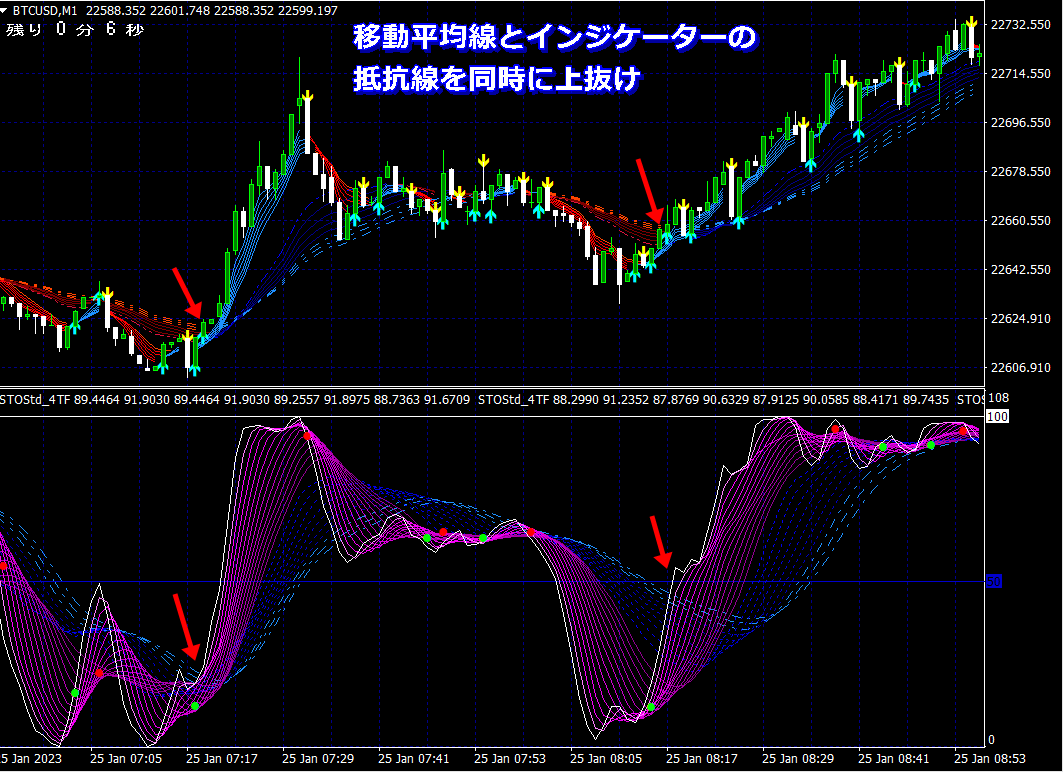
☆ Moving average support/resistance lines (three lines broken) and
the indicator support/resistance lines (three lines broken) also
enter near the breakout points, almost simultaneously!
Among the many moving averages, in an uptrend,
a pullback support line acts as a valid range line to hold as support.
Also, in a downtrend,
a retracement resistance line functions effectively as a valid range line of resistance.
In other words, if in an uptrend the price breaks below the support line, the downtrend begins, and
in a downtrend if the price breaks above the resistance line without bouncing, an uptrend starts.
In short, the support/resistance lines become reversal (turning) lines.
This idea also applies to indicators.
In the Tenchi Chart (Reiwa edition), not only moving averages but
indicator curve bands also serve as support/resistance lines = turning lines in a clear, easy-to-understand display.
\ The GoGoJuang product page for 【Tenchi Chart (Reiwa Edition)】 is available at here/
https://www.gogojungle.co.jp/tools/indicators/42380