☆Nikkei 225 Also Demonstrates Power!☆ [New] Geological Bottom Chart (Reiwa Version)
Tenchin Chart (Reiwa Version) is based on the following core idea,
Support lines and resistance lines = turning lines
This is what it means.
Among the many moving averages, in an uptrend,
there exists a certain width line that functions effectively as a pullback support line.
Also, in a downtrend,
there exists a certain width line that functions effectively as a pullback resistance line.
In other words, if in an uptrend the price breaks below the support line without stopping, a downtrend begins, and
in a downtrend, if it breaks above the resistance line without rebounding, an uptrend begins.
In other words,support lines and resistance lines become turning lines.
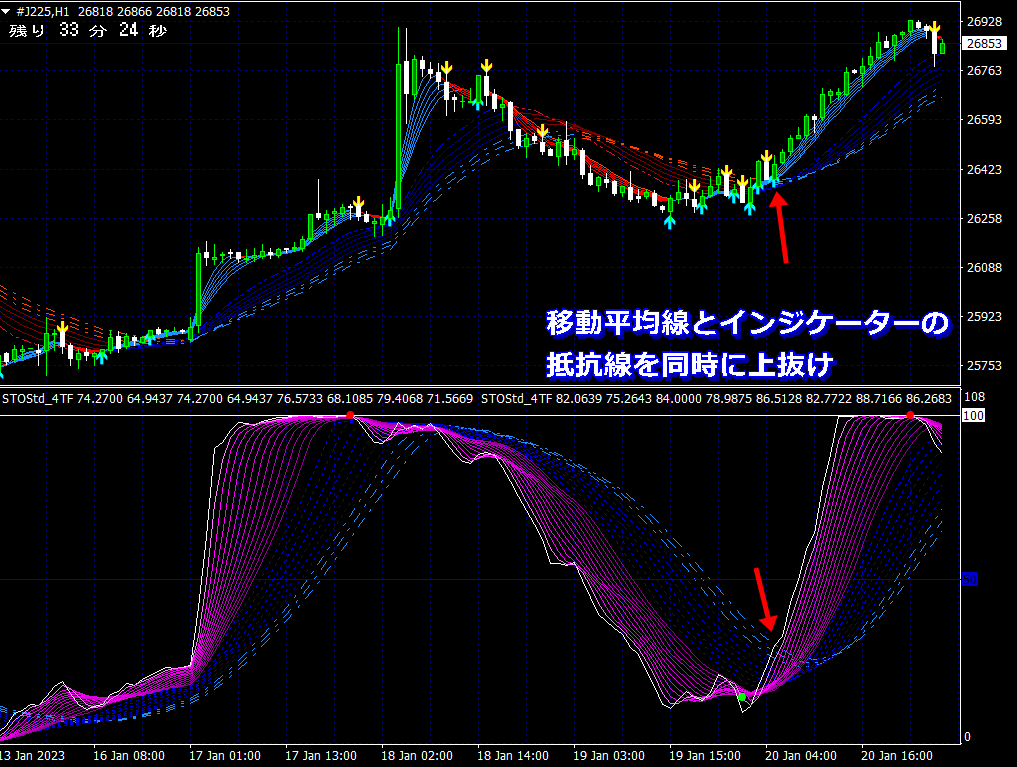
This concept also applies to indicators.
In this product, not only moving averagesbut also the indicator curve bands
display clearly lines that function as turning lines as support and resistance..
Tenchin Chart (Reiwa Version) is, of course,
also effective for Nikkei 225 as well.
This is just one example, but in the most recent 1 hour timeframe
the pattern of guaranteed win became very easy to understand!
For details of this indicator,
Product pageis posted, please take a look.
Of course, FX, Nikkei, and binary options can be used across all timeframes.
Charts for all timeframes are also
Product pageis publicly available, so please
be sure to take a look.
\ 【Tenchin Chart (Reiwa Version)】 is available on the Gogojan product page here /
https://www.gogojungle.co.jp/tools/indicators/42380