Points & Figures Screen Introduction
Points & Figures Screen Introduction
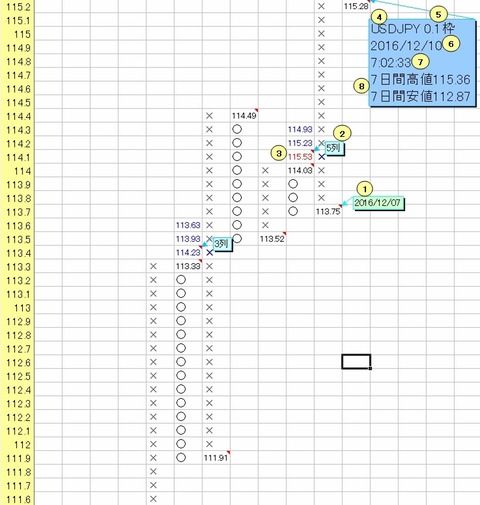
① Hovering the cursor displays the date of the retracement point in a comment
② The number of columns that serves as the standard for horizontal calculation of the target value (target)
③ Based on ②, display the target value calculated horizontally, and the values calculated horizontally based on (the number of standard columns - 1) and (the number of standard columns - 2).
In other words, when it is displayed as [5 columns] and a comment, it shows the target values calculated horizontally based on [5 columns], [4 columns], and [3 columns].
Compared with the “~ days (hours) high” and “~ days (hours) low” at the time the P&F was created (item ⑧),
if the upward target value is less than or equal to the “~ days (hours) high,” it is displayed in blue; if it exceeds the “~ days (hours) high,” it is displayed in red.
If the downward target value is less than the “~ days (hours) low,” it is displayed in red; if it is greater than or equal to the “~ days (hours) low,” it is displayed in blue.
Specifically, among the latest three target values in ③, “114.93,115.23,115.53”
“114.93 and 115.23” are blue because they are less than or equal to the ⑧ “7-day high of 115.36.”
“115.53” is red because it exceeds the ⑧ “7-day high of 115.36.”
The upward signal is shown on the P&F chart as a blue "✕" and the downward signal as a red "〇".
④ Display the currency pair/stock selected in the Stooq data retrieval form and the Invesco FX24 data (if Invesco FX24 data is selected, display the number of minutes before the currency pair).
⑤ Display the reference frame set in the “Settings” form or the “Points & Figures” form
⑥ The date this P&F chart was created
⑦ The time this P&F chart was created
⑧ The high and low for the number of days rolling back from the creation date used to determine whether the target value is achieved.
This “number of days” is configured by entering the number of days into the “~ days high/low” field in the “Settings form” ②.
Additionally, when using the Invesco FX24 data, the display shows “~ hours high/low” depending on how many rows are imported.