

The "Tendai Line" FX indicator catches the bottom and top at perfect timing! It provides alert notifications to your smartphone, allowing entries at the best timing for big gains.
The “Tenchin Line” is a FX indicator that captures the bottom and top at exquisitely timed moments.
It provides a top and bottom sign from the deviation rates of each of the three moving averages. Moreover, when a sign appears, there is an alert notification (smartphone, email, popup alert), so once the sign appears, you just enter.
I have used hundreds of indicators and developed many, but I believe the accuracy and win rate of this indicator are the best. By using this indicator, there are many cases where you can gain over 100 pips in one day.
Features of the “Tenchin Line”
- From the deviation rates of the three moving averages, arrows appear at the top and bottom as signs.
- The deviation rates from the three moving averages can be changed with parameters.
- The periods of the three moving averages can also be changed. The defaults are 25-day, 75-day, and 200-day moving averages.
- Available for all currencies and all time frames.
- There is an alert notification (smartphone, email, popup alert), so you can enter immediately.
- When the market moves strongly, many signs appear, so you can gain large pips.
Purchase here
https://www.gogojungle.co.jp/tools/indicators/42081
Performance of the “Tenchin Line”
AUD/CHF 1-hour chart
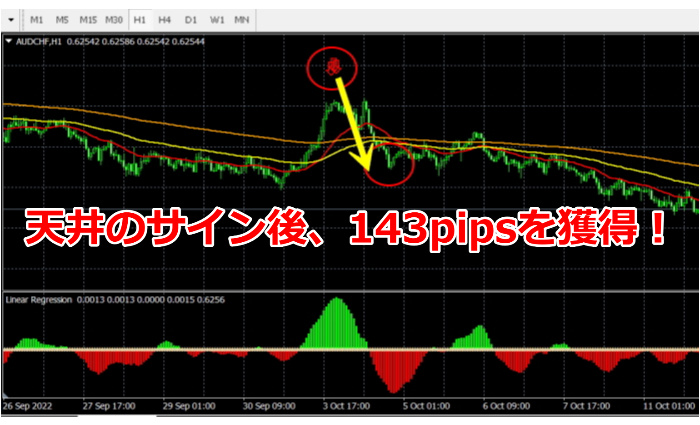 From the top sign, it dropped significantly.143 pips were gained!
EUR/AUD 1-hour chart
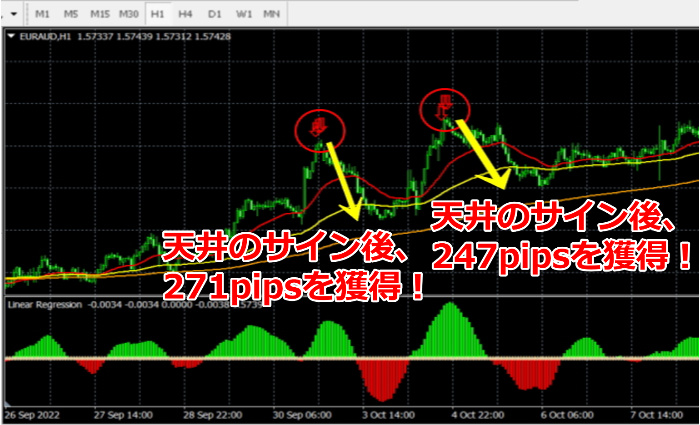 From the top sign, it dropped significantly. Total518 pips were gained!
USD/JPY 1-hour chart
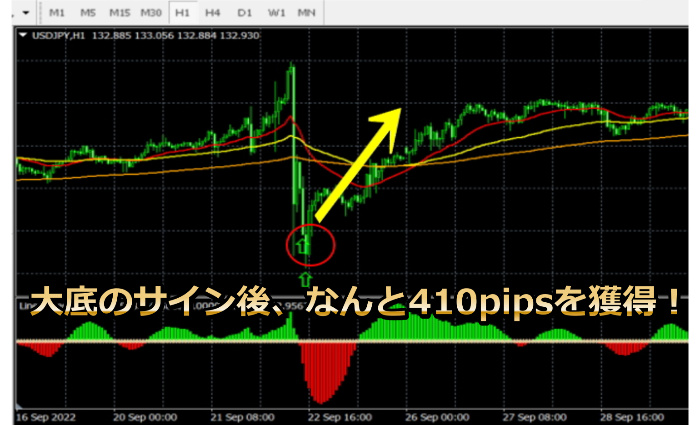
It rose sharply from the bottom sign.410 pips were gained!
XAU/USD 1-hour chart
From the top sign, it dropped significantly. Maximum452 pips were gained!
GBP/USD 1-hour chart
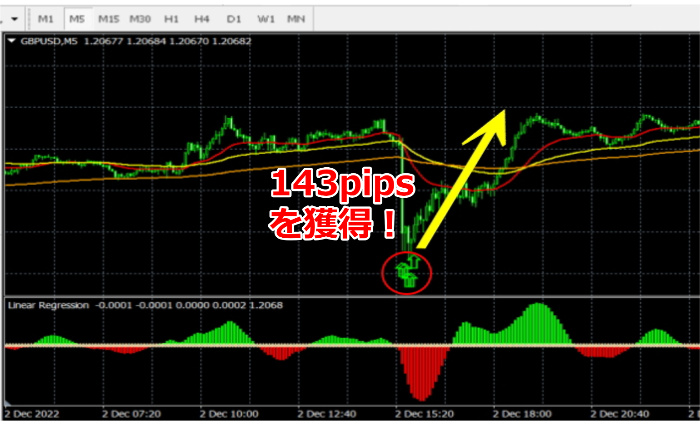
It rose sharply from the top sign.143 pips were gained!
Gold 5-minute chart
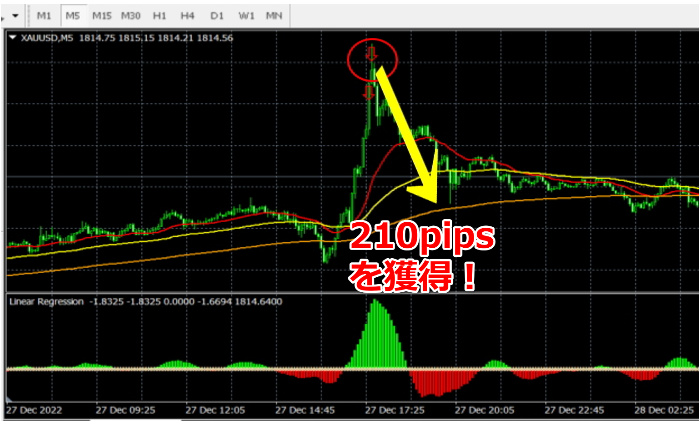
From the top sign, it dropped significantly.210 pips were gained!
Silver 5-minute chart
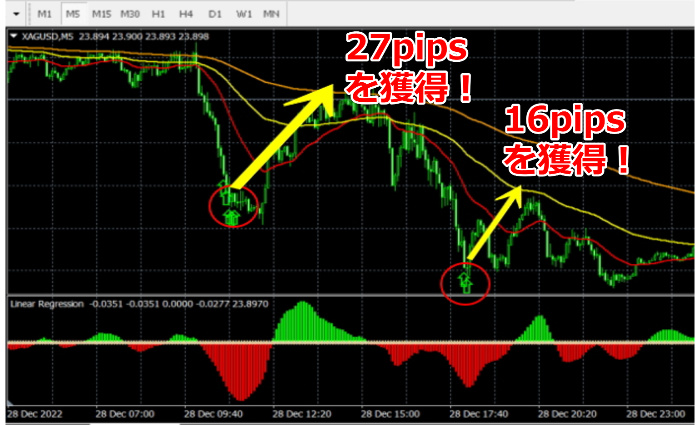
It rose significantly from the top sign. Total43 pips were gained!
Gold 1-minute chart
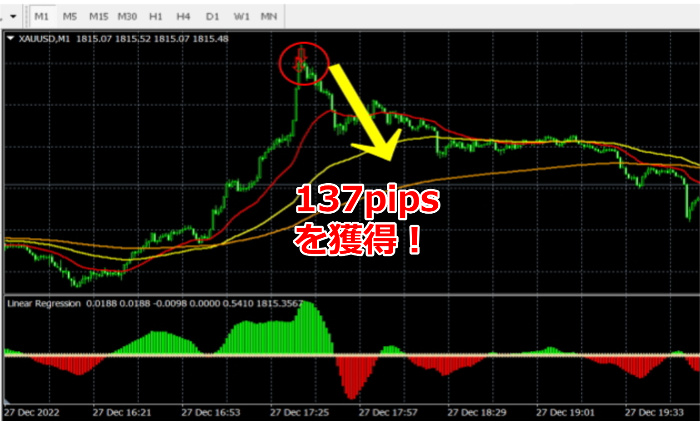 From the top sign, it dropped significantly.137 pips were gained!
About the deviation rate parameters of the “Tenchin Line”
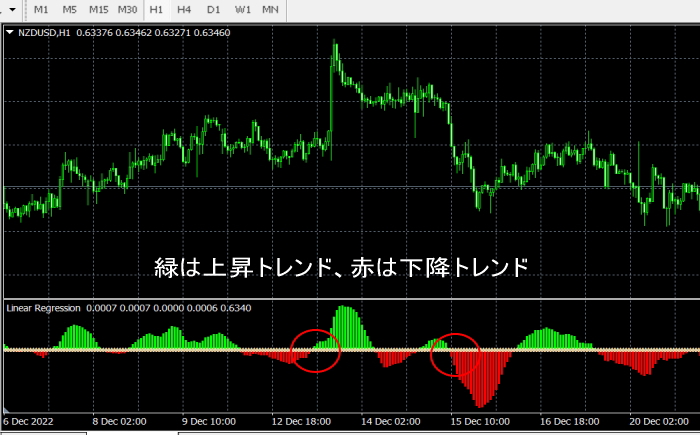
The optimal values for deviation rates vary by currency. The basic setting uses -1% for buying and -1% for selling, but we recommend changing the parameter values to place the arrows at the best timing. After this setting, similar optimal timing arrows will continue to appear.An indicator that shows Bollinger Band contraction status is also included
An indicator that shows Bollinger Band contraction status by color: green for buy signals, red for sell signals.
Purchase here
https://www.gogojungle.co.jp/tools/indicators/42081