

Utilization of “Visualization Indicators” (Part 73)
Utilization of the "Visualization Indicator" (Part73)
1. Further evolve the "28 Currency Pair List Indicator" into an indicator
“8CP Visualization Indicator”to draw EURAUDEURAUDon the chart
The “8CP Visualization Indicator” includesOceania version,LondonNewYork version,AnyCP version. This time, theOceania
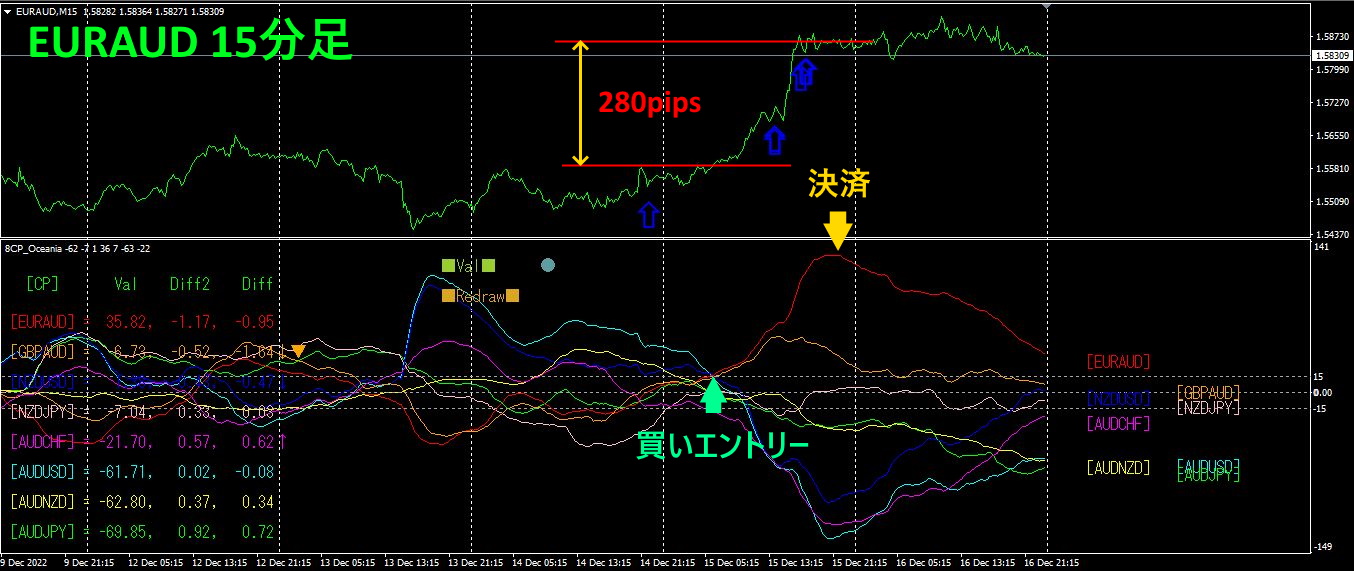
The top half is theEURAUD 15-minute chart. The light blue arrows in the top half indicate the alert positions of the “28 Currency Pair List Indicator”. The bottom half shows what the “8CP Visualization Indicator” displays. The red graph corresponds toEURAUD.
The EURAUD graph was bought when it broke above the other graph group, and the position was exited when the EURAUD graph stopped rising. This resulted in a profit of about280 pips.The entry for the buy was right at the level that just broke above the most recent high. We captured the most lucrative part of the uptrend without strain.
2. Best SelectTry the Indicator
The following diagram is a screenshot fromDecember 13, 2022 at 22:30 (JST).
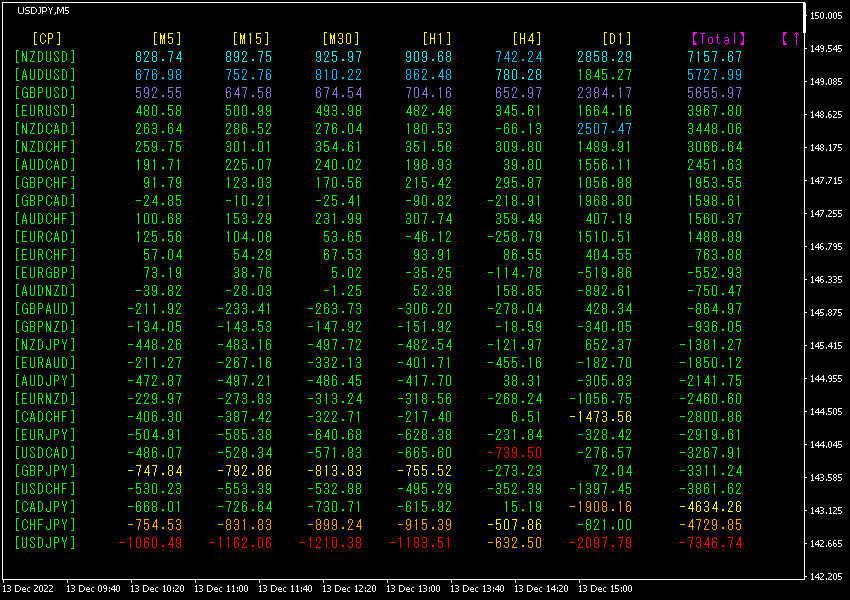
Totalnumbers are sorted in descending order. The bottom row'sUSDJPY is shown in red for [M5],[M15],[M30],[H1],[D1],[Total], indicating negative values such as -7346.74. This shows a strong downtrend for USDJPY.USDJPY indicates a significant downward trend.
The row above showsNZDUSD, which is all in blue hues, and theTotal value is7157.67.This indicates an uptrend in NZDUSD.
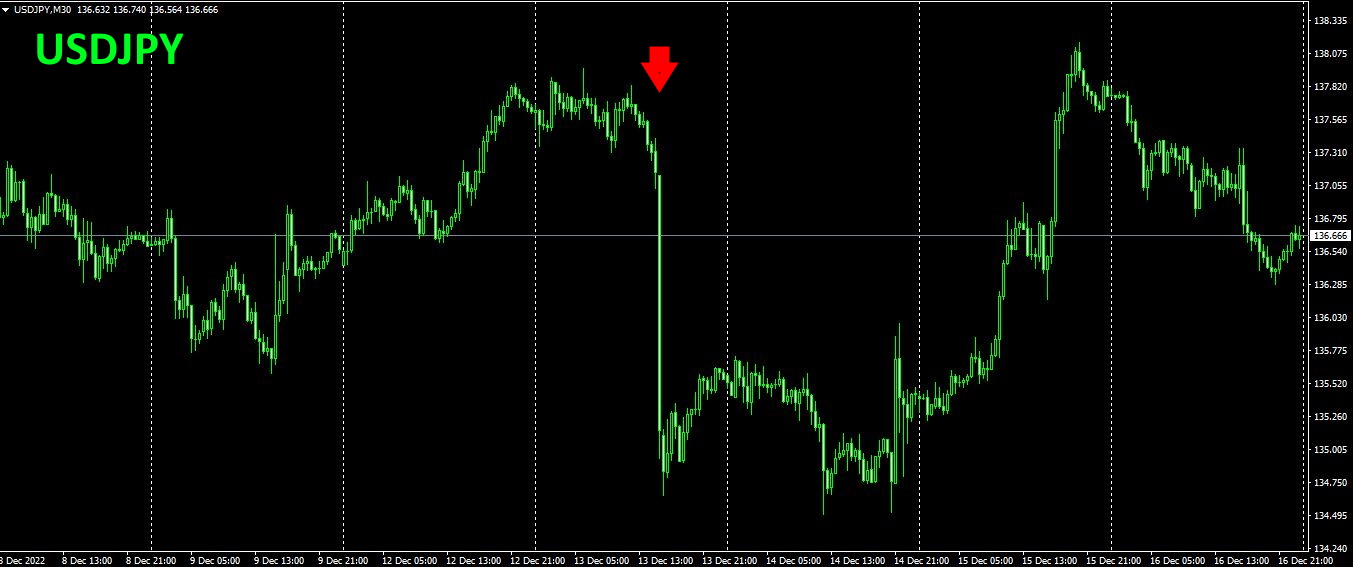
Now, let us look at the USDJPY chart.
Next, let us look at the NZDUSD chart.
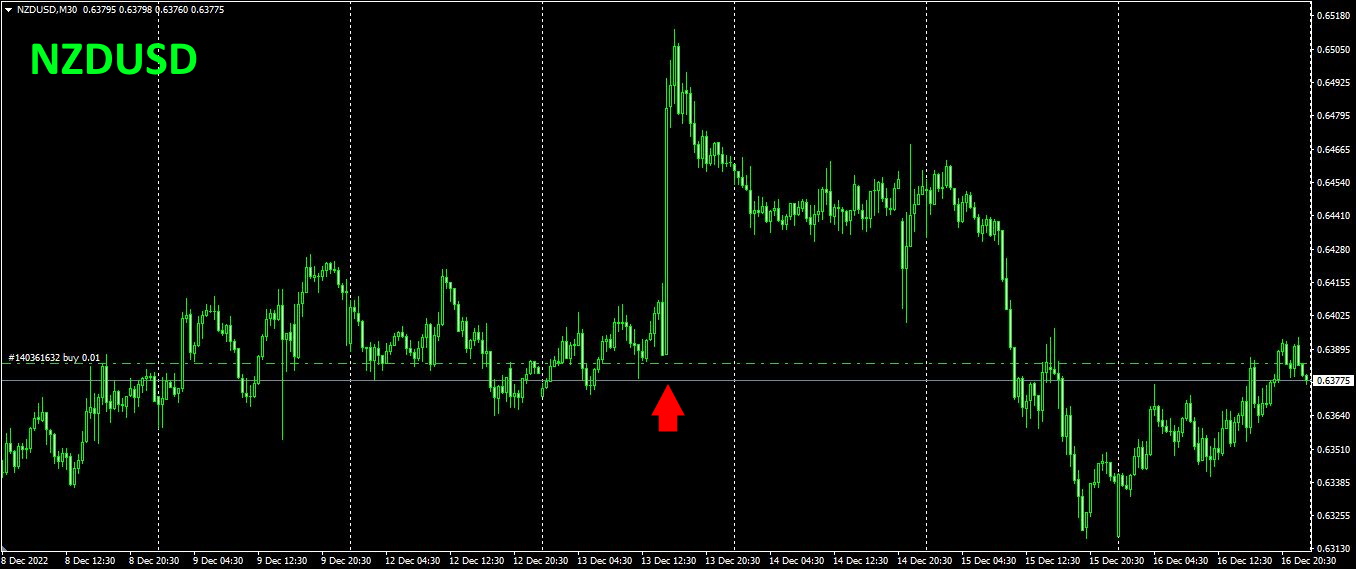
12month 13 day 22:30 (JST), USDJPY declines, NZDUSD surges. This is due to a macroeconomic release (US: Consumer Price Index). As a result, the dollar-yen fell by more than2 yen.
Until now, the US has been plagued by rapid inflation, but
The CPI came in below expectations→ inflation weakens→ the Fed may pause rate hikes→ interest rates drop→ dollar-yen falls
This cause-and-effect chain like the saying “When the wind blows, the bucket maker profits,” led to a drop in the dollar-yen. However,2 days later, it returned to its previous level.
3. What happened to EURJPY, tracked since last MayMay, last year? has shown movement since May 2021.
To see the overall trend, we描いて approximately three weeks of the last 30-minute chart.
Previously, I wrote the following.
Since the JPY tends to move downward more strongly, I think EURJPY will trend slightly upward.
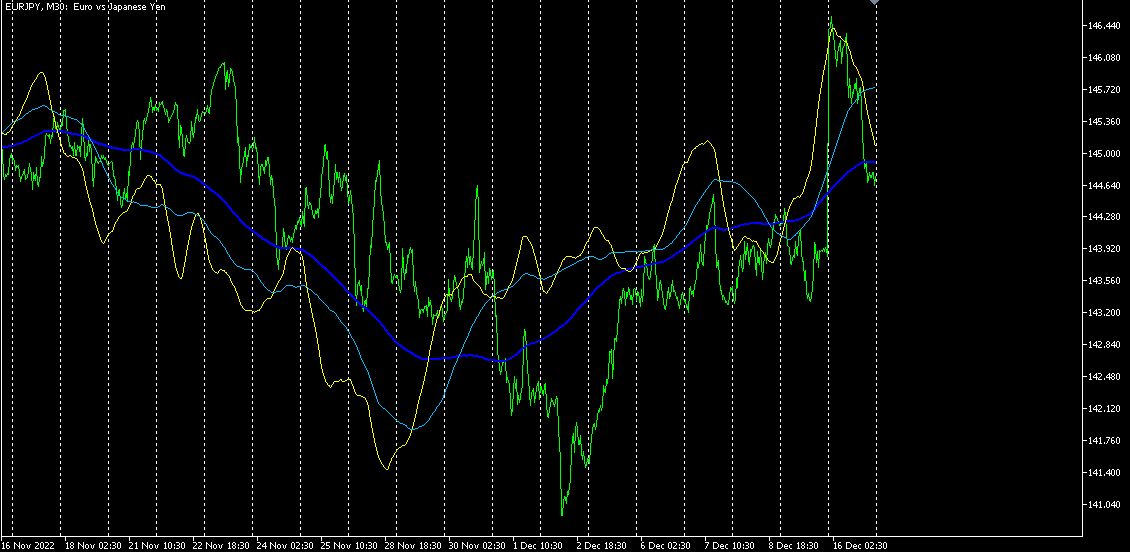
It has risen firmly.
4Refer to the hourly currency strength chart.
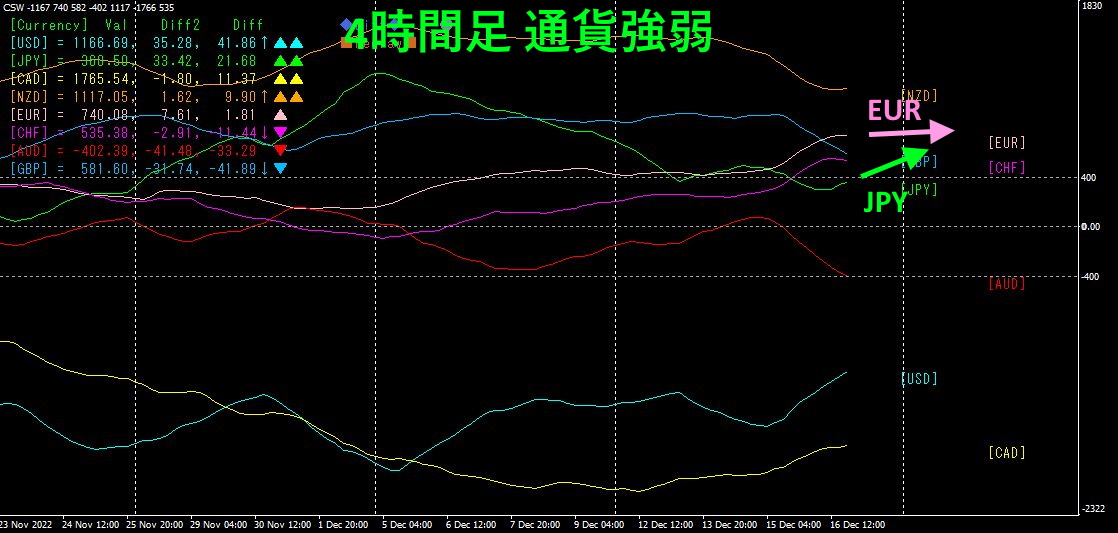
Pink isEUR, green is.JPYJPY is moving up,EUR is also rising, but its rise is weaker thanJPY, hence EURJPY is expected to trend slightly downward.
If you are interested in the “8C Currency Strength Visualization Indicator,” please refer to the page below.
MT4 version https://www.gogojungle.co.jp/tools/indicators/39150
MT5 version https://www.gogojungle.co.jp/tools/indicators/39159
【My listed products】


