

Utilization of "Visualization Indicators" (Part 72)
Utilization of the "Visualization Indicator" (part72)
1. Further evolve the "28 Currency Pairs List Indicator" into an indicator
"8CPVisualization Indicator"toGBPAUDdraw
There are versions for Oceania,Oceania版,London版,NewYork版,AnyCP
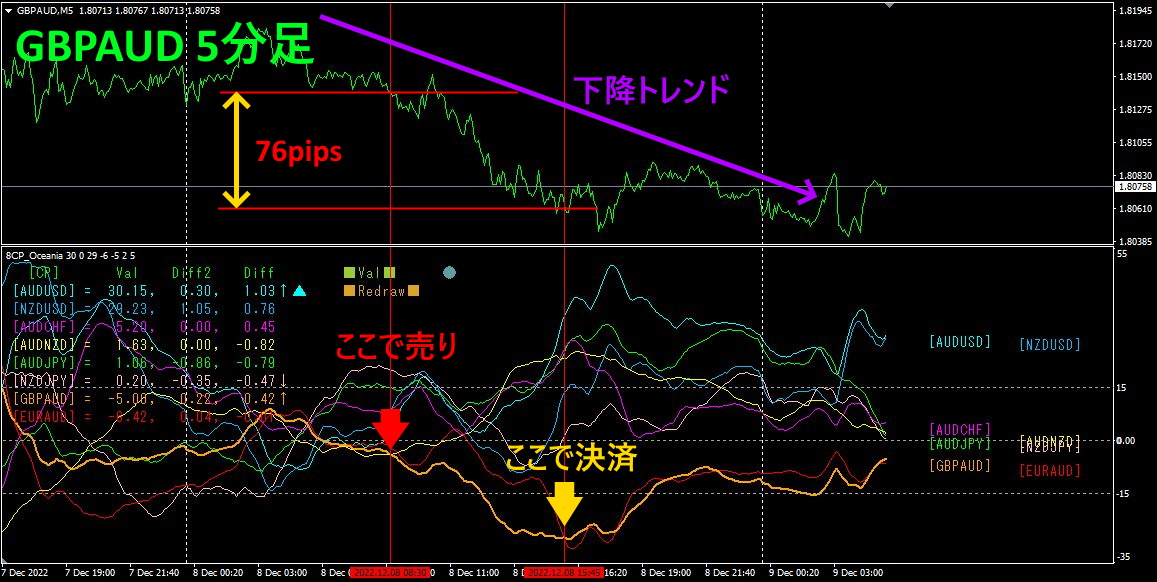
2022年12月8日のデイトレードです。上半分は、GBPAUDの5分足チャートで、下半分は、「8CP見える化インジケータ」によるものです。オレンジ色太線のグラフがGBPAUDに相当します。GBPAUDの5分足チャートで、下半分は、「8CP見える化インジケータ」によるものです。オレンジ色太線のグラフがGBPAUDに相当します。
のグラフが、他のグラフ群を下抜けしたところで売り、GBPAUDのグラフの下降が止まったら決済します。76pipsの利益76pipsの利益ですから、十分でしょう。下降トレンドの最も美味しいところを獲ることができました。
2. Best Selectインジケータを使ってみる
The figure below is a screenshot taken on2022年12月9日10:14(JST)
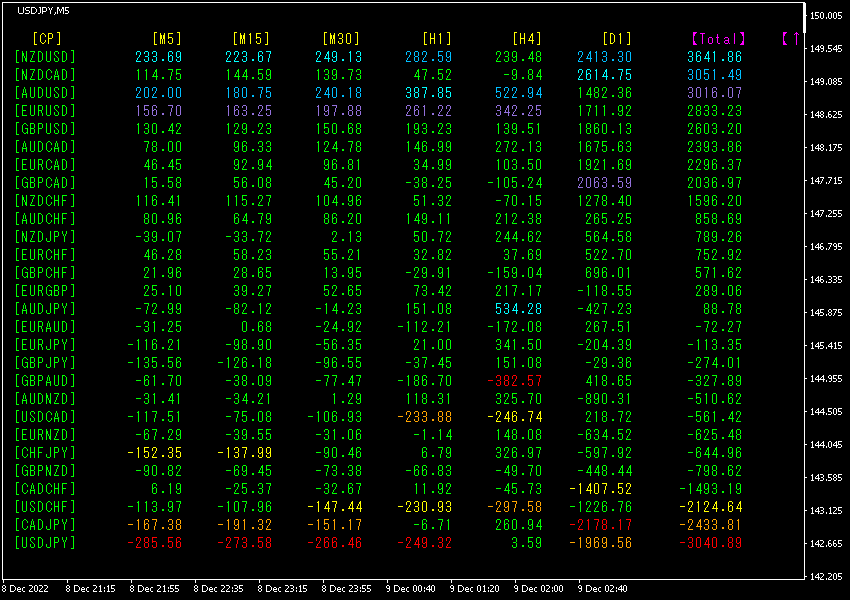
The row above, NZDUSD, is shown in blue tones, and the Total value is3641.86. This indicates an uptrend in NZDUSD.
Now, let's look at the USDJPY chart.
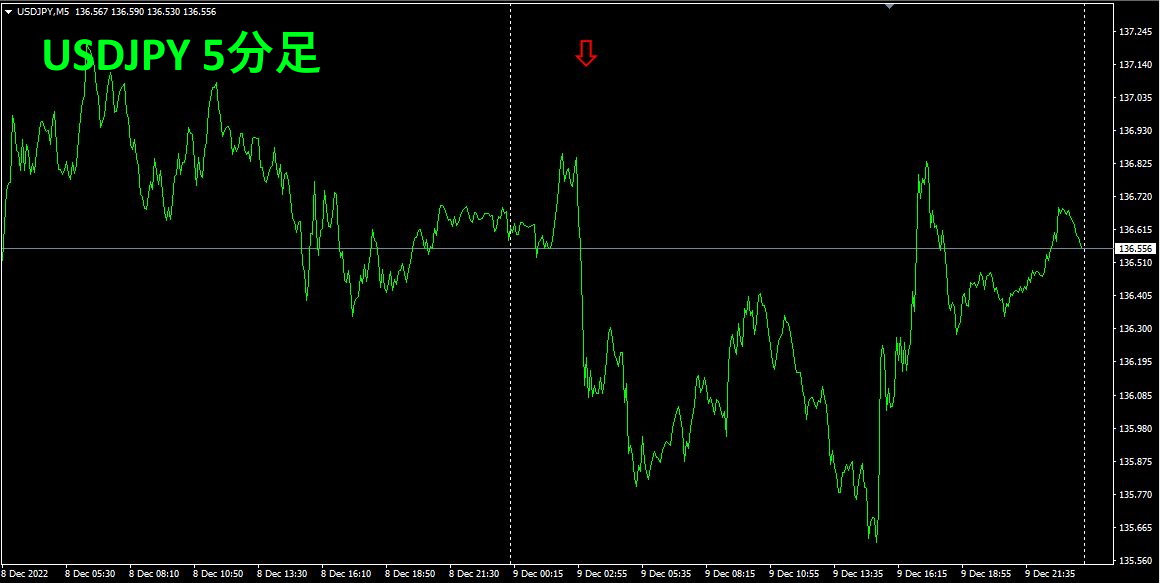
A screenshot was taken with a red arrow.
Next, let's examine the NZDUSD chart.
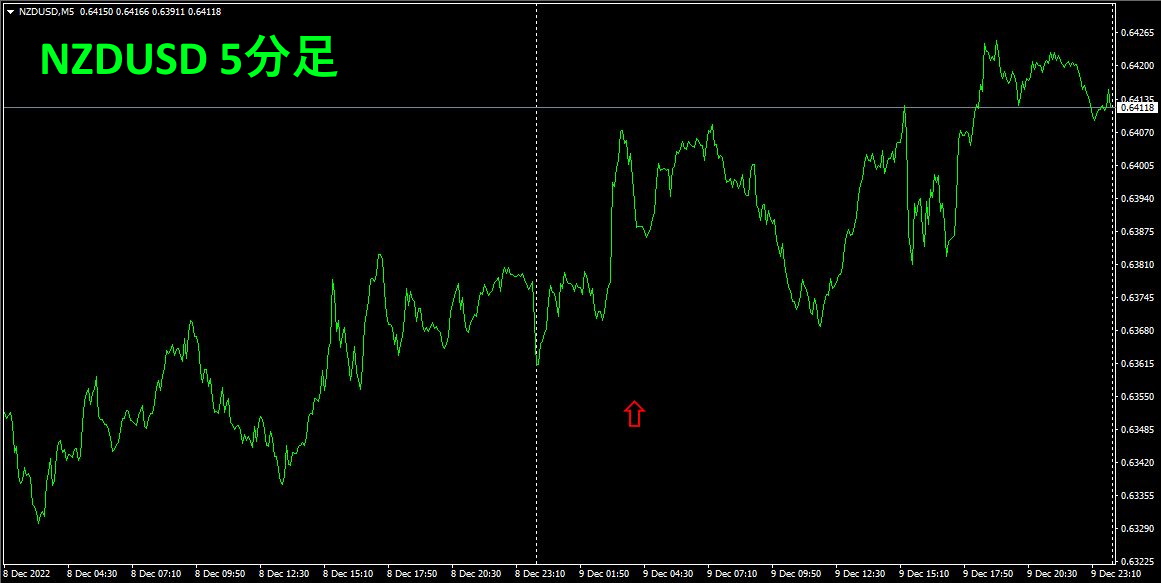
USDJPY captures a sharp drop during a downtrend, whileNZDUSD captures a sharp rise during an uptrend.
3. What happened to EURJPY since last May?
Since May 2021,年5月EURJPY
To see the overall trend, a 30-minute chart covering roughly the last three weeks has been drawn.
Last time, it was written as follows.
Since the yen is likely to remain weak for a while,EURJPY is expected to continue declining.
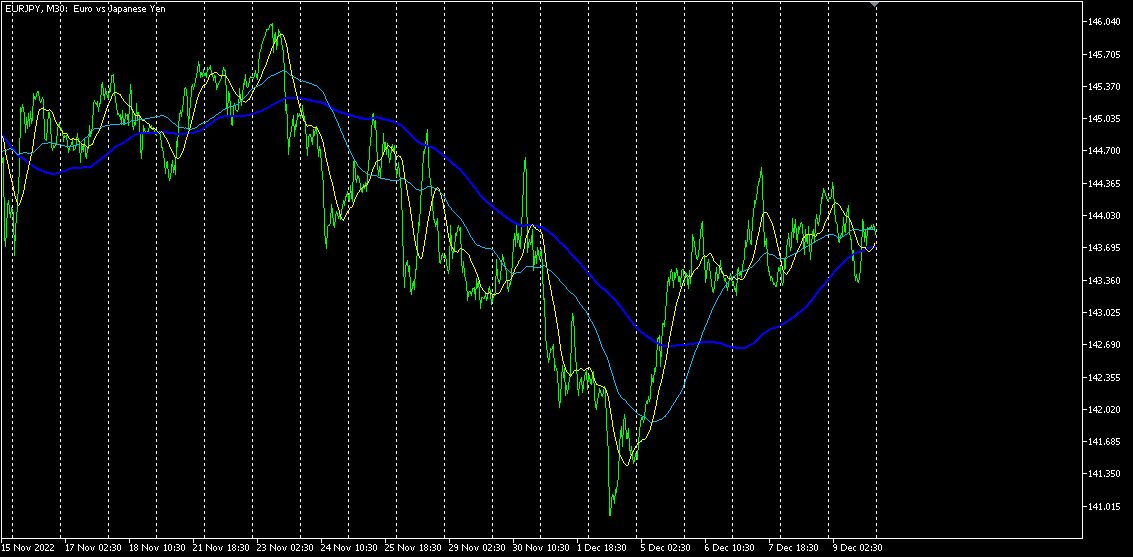
It rose contrary to expectations.
4Refer to the currency strength chart on the time frame.
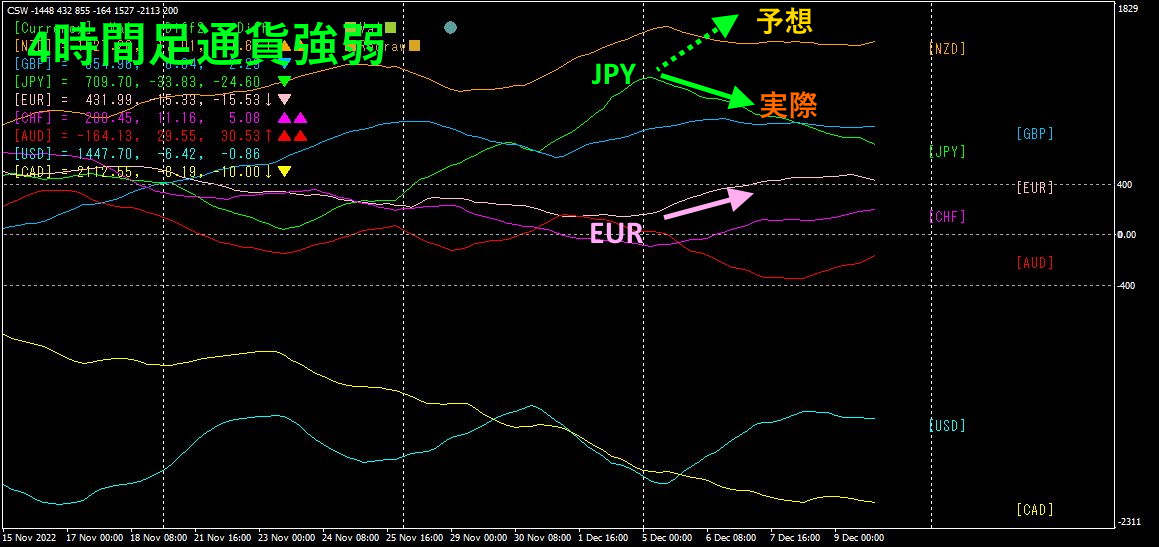
Pink isEUR, green isJPY. As of the end of last weekend,JPY was pointing up,EUR was slightly downward, so EURJPY was expected to trend downward, butJYP turned downward, resulting in EURJPY rising.
Now, what will be the direction of EURJPY? Looking at the currency strength graph,JPY andEUR are both slightly downward. If forced to choose, I thinkJPY is more downward, so EURJPY may move slightly upward.
4. 「The Ultimate Inverse Correlation Indicator」 has been released
Previously, we introduced theDaily Bottom-Top root-cut Indicator, but the core of the Daily Bottom-Top Root-Cut Indicator is an indicator that displays the inverse correlation for all 28 currency pairs as numerical values.
It is a realization of a developer's wish to numerically compare currency strength correlations. It allows comparing three key elements—“Correlation Coefficient,” “Volatility,” and “Change Rate”—as numbers. Of course, there is a sorting function, so you can easily find the currency pair with the largest inverse correlation coefficient, the currency pair with the largest volatility, and the currency pair with the largest change rate.
When you change the timeframe, these numbers change accordingly. It is基本 used on daily or longer timeframes, but it also holds power for shorter timeframes.
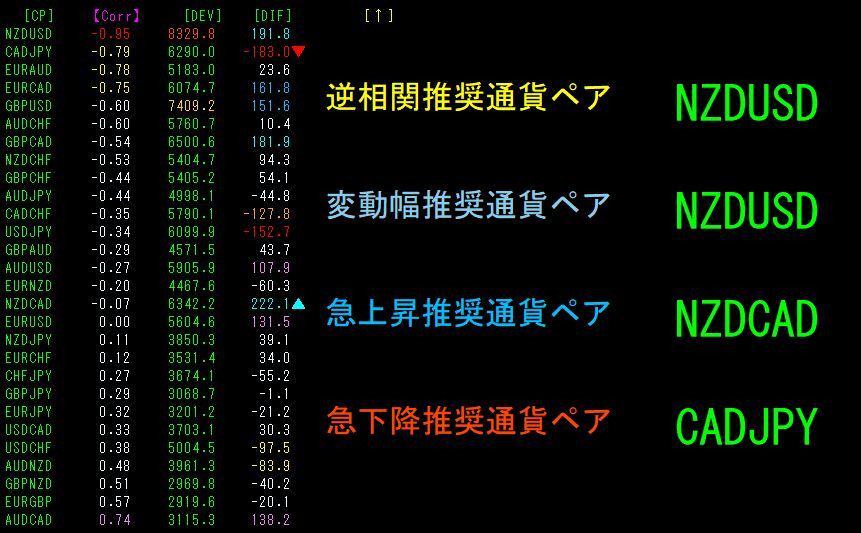
The diagram above is a screen capture when introduced on the daily chart.NZDUSD appears inverse correlated, with a correlation coefficient of-0.95, volatility among the 28 pairs is the28 largest, and change rate is thelargest among the 28 pairs, indicating the highest in those metrics.
“If you trade on the daily chart, buying NZDUSD is the move!”Such a well-founded choice becomes accessible to anyone with this indicator. Used together with the Daily Bottom-Top Indicator, it becomes a trader’s ally.
In particular, NZDUSD is currently performing exceptionally well and seems likely to rise further.
If you are interested, please refer to the following links.
The Ultimate Inverse Correlation Indicator
https://www.gogojungle.co.jp/tools/indicators/41656
Daily Bottom-Top Root-Cut Indicator
https://www.gogojungle.co.jp/tools/indicators/41351
If you are interested in the “8C Currency Strength Visualization Indicator,” please refer to the page below.
MT4版 https://www.gogojungle.co.jp/tools/indicators/39150
版 https://www.gogojungle.co.jp/tools/indicators/39159
【Items I have for sale】


