
Weekly Chart Analysis December 4, 2022
✿ Review of the Previous Article ✿
Last week, in stock indices, major FX, and gold alike,all moved roughly in line with analysisas expected.
However, the analysis reflects the current status at the end of the week,and there is a possibility that the situation could change significantly in the meantime, so please keep that in mind as you review.
✿ Indices ✿
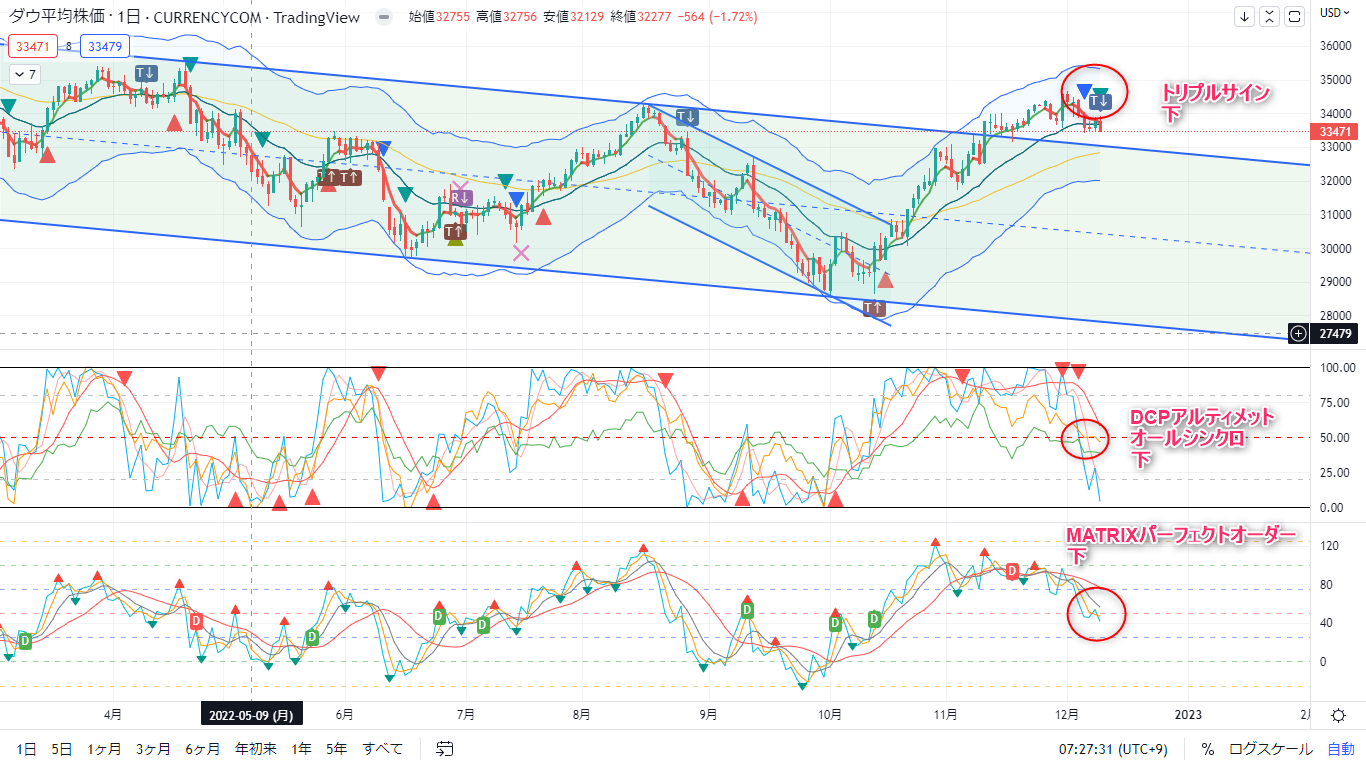
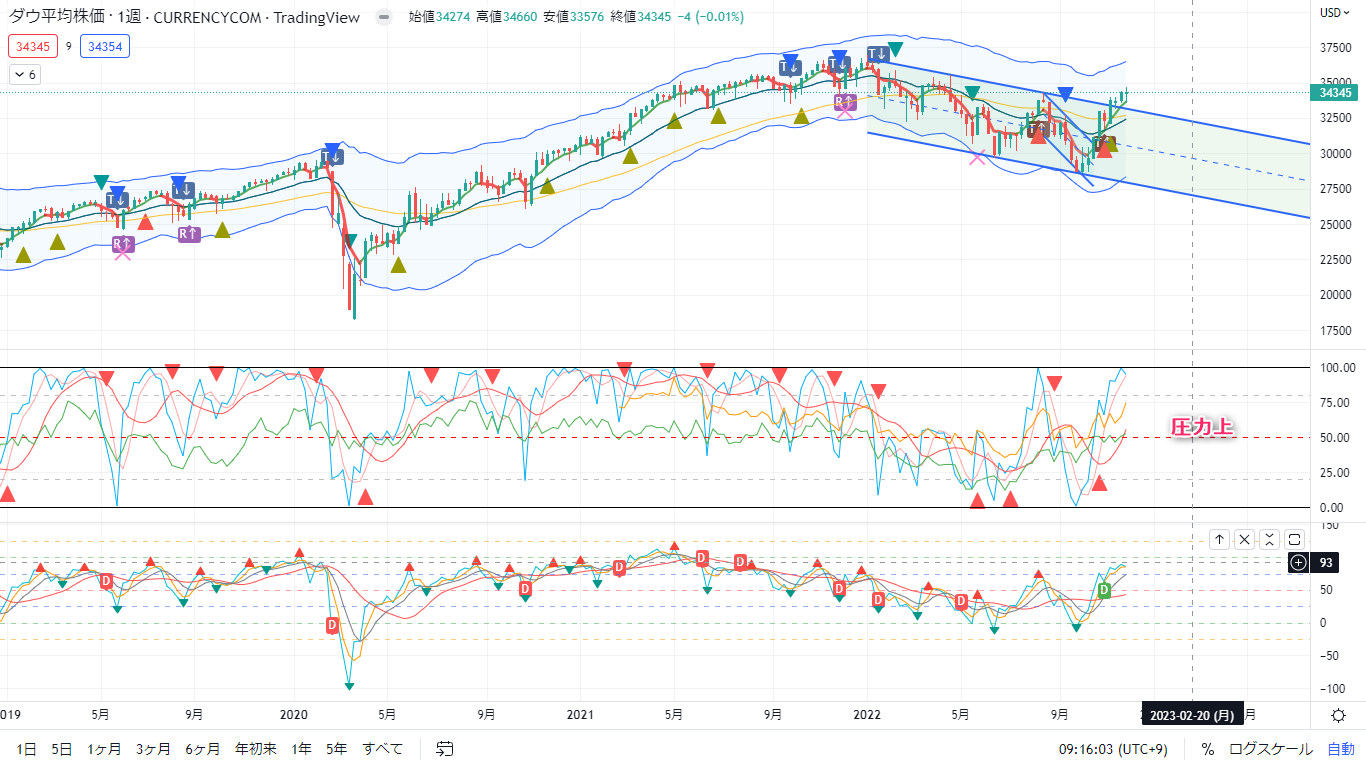
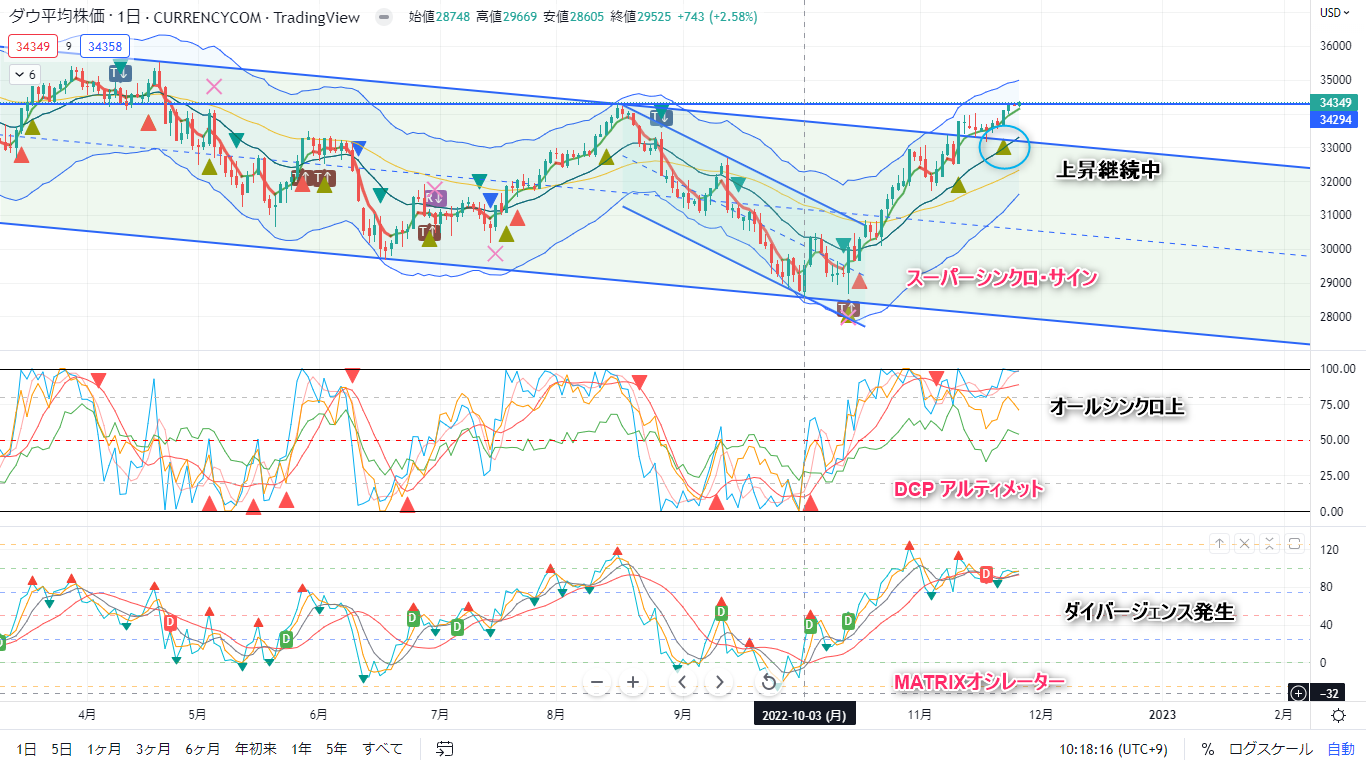
※US30 (Dow Jones Industrial Average)
☆Weekly
☆Daily
☆4-hour
Overview
Weekly indicates a potential rise/Daily shows a cautious alert・Divergence appears in MATRIX/4-hour consolidation
Concerns
In the 4-hour chart, divergence occurs in the MATRIX oscillator
Overall assessment
There is a slightsoftening of upside pressureand the market is in a range consolidation. While an upside stance cannot be abandoned yet,,


should we be cautious about chasing new highs.
※NAS100
☆Weekly
☆Daily
☆4-hour
Overview
Overall uptrendis in place, but we should watch whether the 4-hour chart clearly shows upside signals
Concerns
Whether the 4-hour chart misalignment resolves to the upside or the downside will determine the next move
Overall assessment
Basically looks like it is leaning higher, butwhether clear upside signs appear on the 4-hour chart will be decisive
※SP500


☆Weekly
☆Daily
☆4-hour
Overview
In a broad uptrend, a weak pullback on the 4-hour chart has led to range-bound action after the rise
Concerns
The 4-hour chart has not yet clearly signaled upside
Overall assessment
Basically it appears to remain biased to the upside,but the key is whether the 4-hour chart clearly shows upside signals.
※Nikkei 225
☆Weekly
☆Daily
☆4-hour
Overview
In the 4-hour chart, there is a strong declineoccurrenceand day-to-day support signals appear on the daily and intraday levels
Concerns
Decline signals are also appearing on the daily chart
Overall assessment


At the weekly level, it is hard to say the downtrend is in place, butwhether the daily and 4-hour declines stay within the rising channel is the key
A wait-and-see for new buying would be prudent for now
Overall Indices Summary
US stock indices have not fully broken the upside outlook and remain firm,but the near-term upside momentum is weakening, so a cautious stance may be warranted
Nikkei 225 is leading and declining, so watch its trajectory closely.
Furthermore,the overall US equities could turn lower on the daily chart,,so buying should be approached cautiously.
✿ Major Forex ✿
※USDJPY
☆Weekly
☆Daily
☆4-hour
Overview
All indicate a downside movement
Concerns
Slight divergence on the 4-hour chart
Overall assessment
Overall bias to the downside is appropriate.There may be sudden upside moves on events or specific times or daily adjustments, but


basically, selling rallies is more appropriate.
※GBPUSD
☆Weekly
☆Daily
☆4-hour
Overview
Weekly and daily both suggesting upside
Concerns
Divergence appears in the 4-hour MATRIX oscillator
Overall assessment
There may be selective declines in certain times or days, but,the bias remains to the upside, and buying on dips seems reasonable
※EURUSD
☆Weekly
☆Daily
☆4-hour
Overview
Weekly and daily both indicate upside potential
Concerns
Divergence in the 4-hour MATRIX oscillator
Overall assessment
In the time frame or on a daily basis, there may be some corrective declines, butthe bias remains to the upside and buying dips is appropriate
※AUDUSD
☆Weekly
☆Daily
☆4-hour
Overview
While the weekly trend is up, the daily and 4-hour charts show a weakening upside momentum
Concerns
In the 4-hour chart, consolidation is evident, and actuallydownward pressure appears
Overall assessment


Not completely bearish, but it is hard to be bullish right now.Compared to last week,the weakness is more evident versus European currencies
✿ USDCHF
☆Weekly
☆Daily
☆4-hour
Overview
Weekly and daily both indicate a downtrend progression
Concerns
None in particular
Overall assessment
There may be some corrective upside due to events or timeframes, butthe bias should remain downwards
Overall FX Market Summary
The dollar weakness is becoming more pronounced.
While paying attention to the relative strengths of each currency, the big picture may be to follow the dollar weakness.


The weakness of the AUD is notable,and whether the correlation between stock indices and dollar weakness breaks downmay be entering a phase to watch closely.
✿ Simple Cross-Yen Analysis ✿
※ EURJPY Daily
※ GBPJPY Daily
※ AUDJPY Daily
Overview
From the daily view, the declines appear ongoingas of now the AUD/JPY is weakcompared to last week
Concerns
AUD/JPY remains weak
Overall assessment
Considering relative strengths,the primary view is that the downside is appropriate. Of course, adjustments can occur due to events and timing, so respond flexibly to near-term moves


AUD/JPY weakness has become more apparent (as of now)
✿ Gold ✿
※ XAUUSD
☆Weekly
☆Daily
☆4-hour
Overview
Weekly and daily both suggest rising
Concerns
Divergence on the MATRIX oscillator at the 4-hour level
Overall assessment
While responding to intraday wave changes,gradual bottoming and then a strong ascent is a favorable approach,
the major trend should be considered to remain upward.
✿ About the Analysis Tools ✿
① DCP Ultimate
② MATRIX Oscillator
③ Super Syncro Sign
All of these are entirely original indicators (or original uses of existing oscillators), and yet


they offer top-tier accuracy that closely describes chart conditions to an exceptional degree
The MT4/5 version already has over 50 users and is regarded as a highly satisfactory analysis tool by seasoned traders.
November 2022
Released a trial version usable for stocks, FX, indices, bonds, and futures
※ For details, please refer to the product description page below
https://www.gogojungle.co.jp/tools/ebooks/41286