

Use of the "Visualization Indicator" (Part 71)
Utilization of the "Visualizing Indicator" (Part71)
1. Further evolve the "28 Currency Pair List Indicator" into an indicator
“8CPVisualizing Indicator”forNZDUSDcharting
The “8CPVisualizing Indicator” includesOceaniaLondon version,NewYork version,AnyCP version. This time, theOceania version was used.
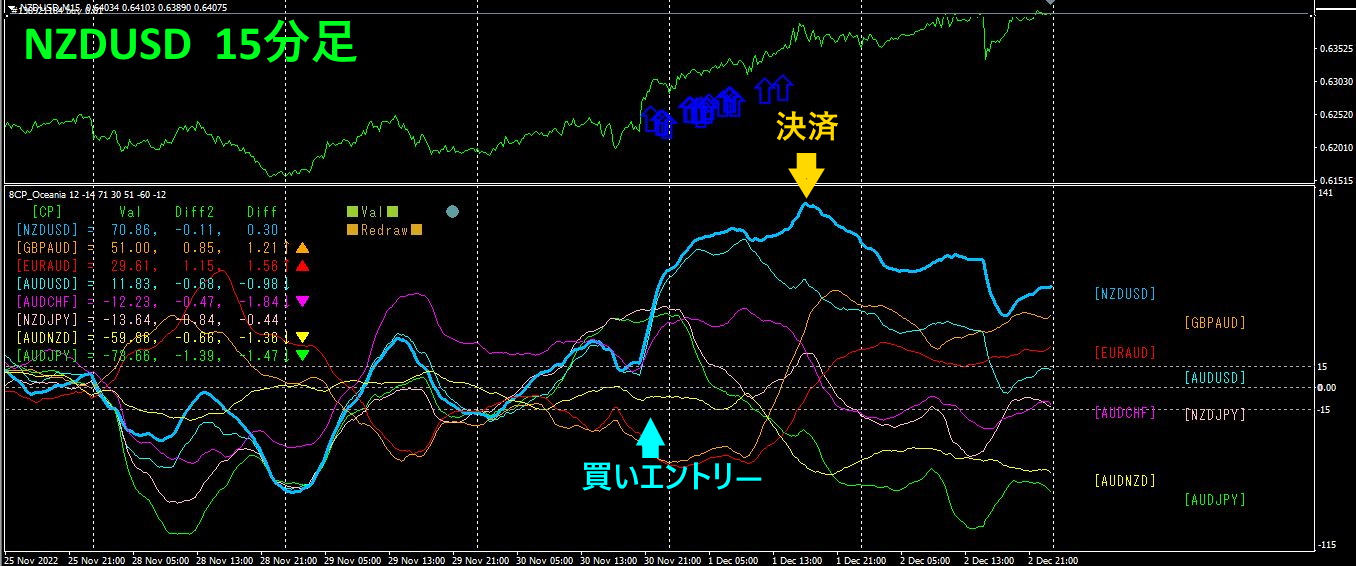
Compared with other currency pairs, the rise ofNZDUSD is pronounced. The upper half is theNZDUSD 15-minute chart, and the lower half is from the “8CP Visualizing Indicator.” The light blue thick line corresponds toNZDUSD.
Holding a long position from Wednesday to Thursday,about90pips in profit. The “Visualizing Indicator”’sNZDUSD graph exceeded the threshold and moved above the others, so we enter a buy—. We will exit if the graph falls. It captures the most profitable part of the uptrend.
2. Best SelectTry the indicator
The figure below is a screenshot taken on2022 year December 10:08 (JST).
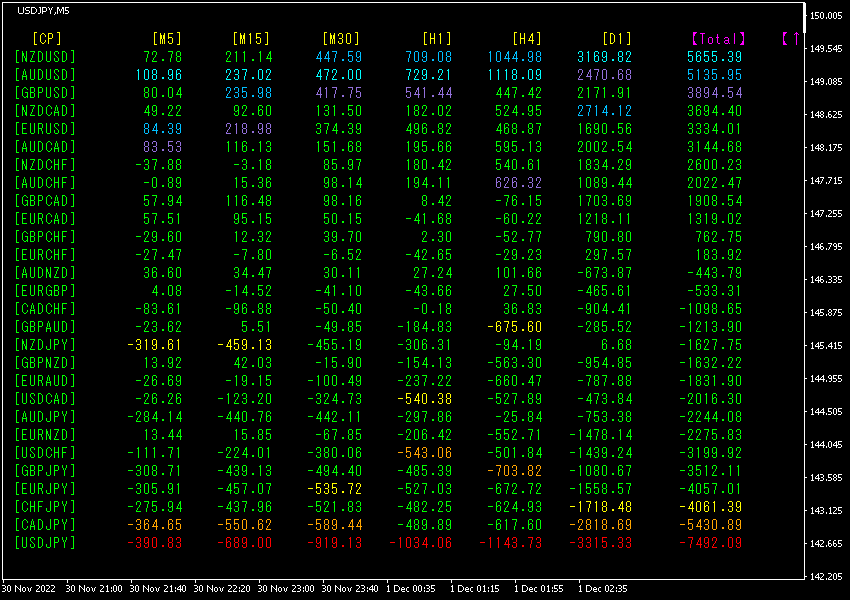
Values are sorted in descending order. The bottom row’sUSDJPY is displayed in red on all time frames, and theTotal value is-7492.09, a large negative figure. This indicates a strong downtrend for USDJPY.USDJPY shows a significant downward trend.
The two lines above,NZDUSD andAUDUSDTotal values exceed5000.NZDUSD andAUDUSD show an uptrend.
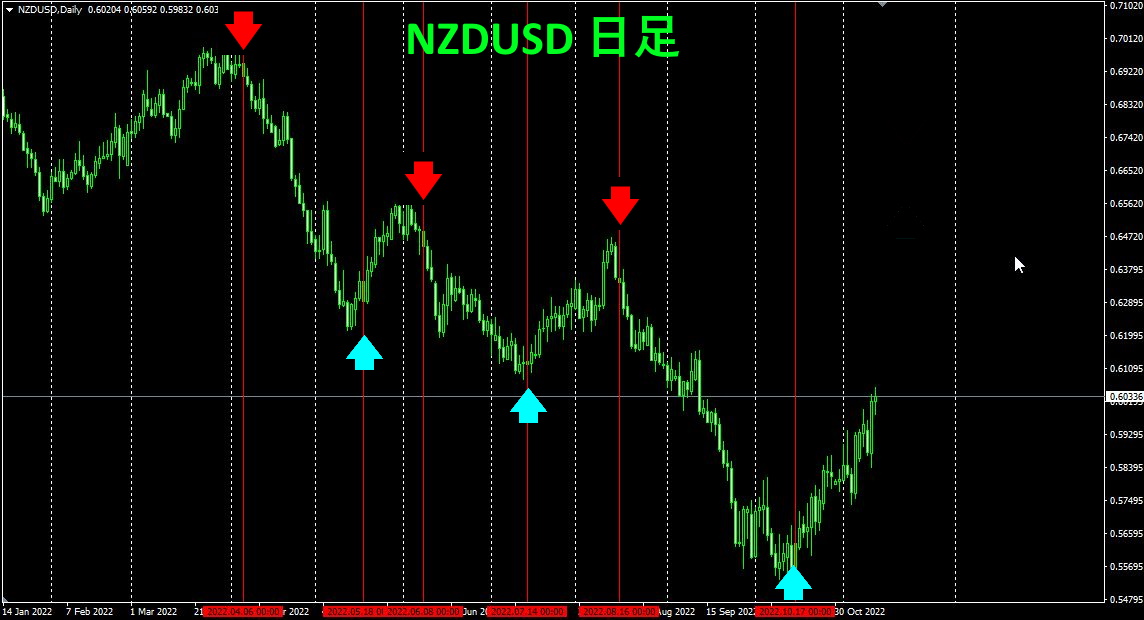
Now, let’s look at the USDJPY chart.
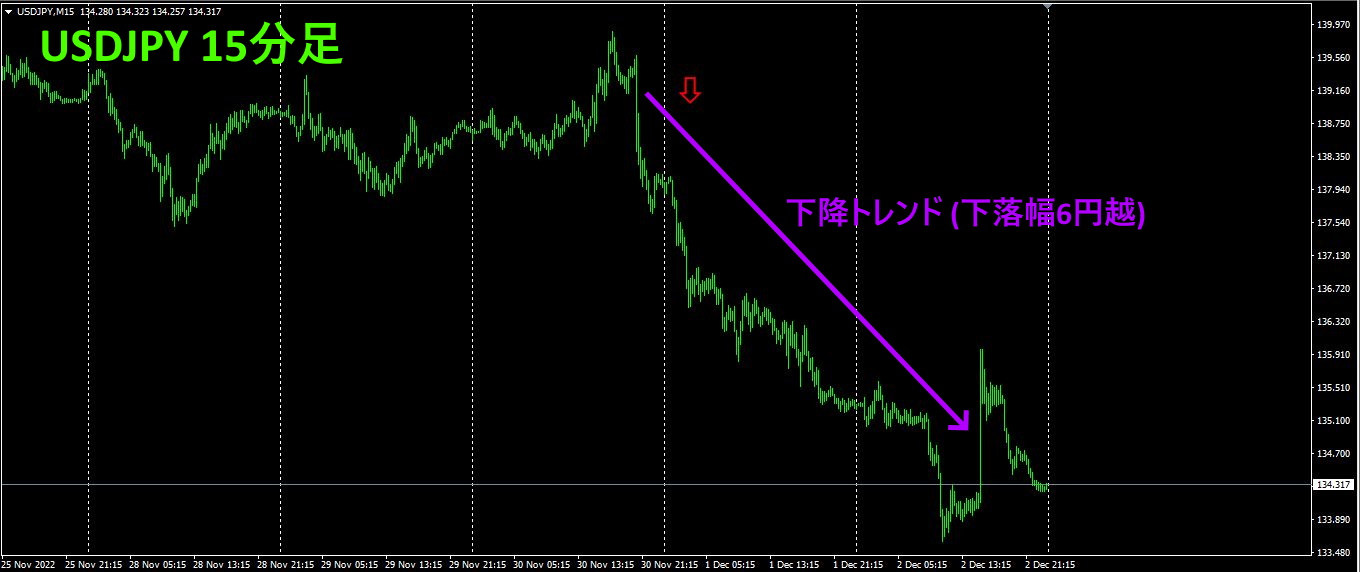
A red arrow marks the screenshot.
The decline exceeds6 pips.USDJPY falls whileNZDUSD andAUDUSD rise, indicating dollar weakness.
3. Since last May, how did EURJPY move?
From May2021 year May, we have trackedEURJPY movements.
To see the overall trend, we draw roughly the last30 minutes on the3 weeks of data.
Last time I wrote the following.
In terms of currency strength, the EUR and JPY are almost equal, and the direction is thatEUR is slightly downward,JPY is nearly flat.
EURJPY is expected to move slightly downward.
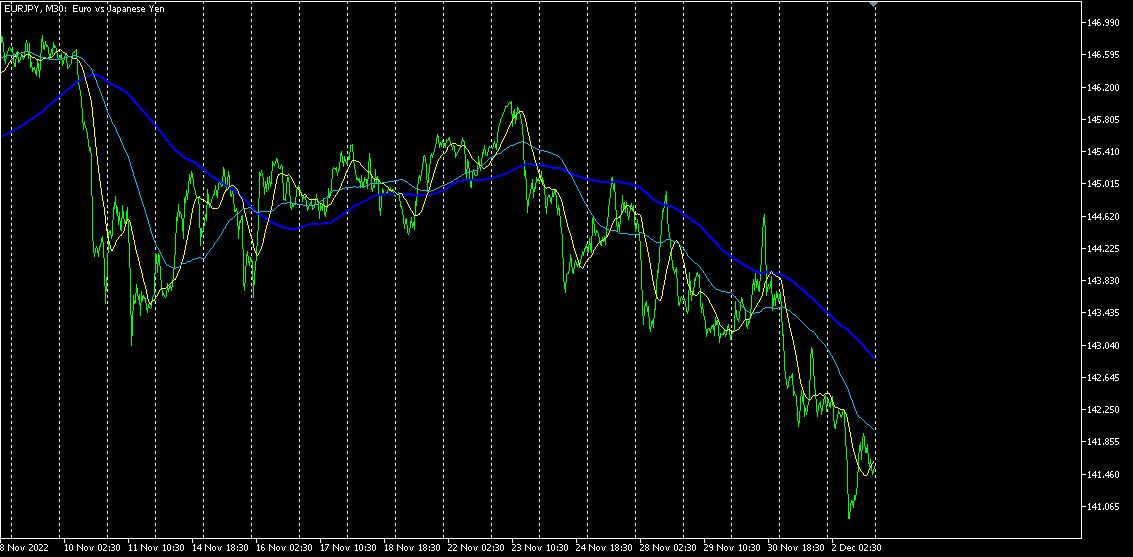
Indeed,EURJPY fell.
4Refer to the 4-hour currency strength chart.
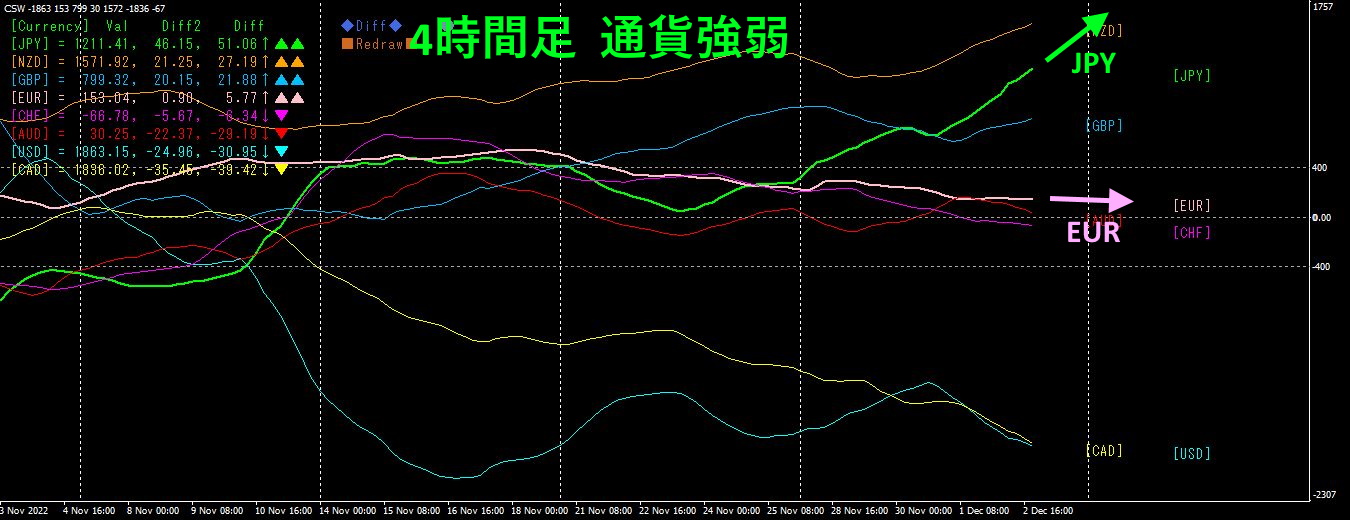
Pink isEUR, green isJPY. Looking at currency strength graphs,EUR is horizontal to slightly downward, whileJPY is rising sharply. As a result,EURJPY falls. The decline inEURJPY during this period indicates a stronger yen.
For a while, the yen is likely to remain strong, soEURJPY is expected to continue falling.
4.
New indicator completed! (Reposted)
A completely new type of indicator has been completed.
The name is,Daily Bottom-to-Top Core Indicator .
This is an indicator introduced on the daily chart that, as the name suggests, aims to capture the full extent of market movements.Hundredspips to thousands can be gained.
The concept looks like the following.
Currently, especially,NZDUSD is performing exceptionally well, and those who purchasedNZDUSD with this indicator are seeing increasing unrealized gains.
Screen showing the indicator in use
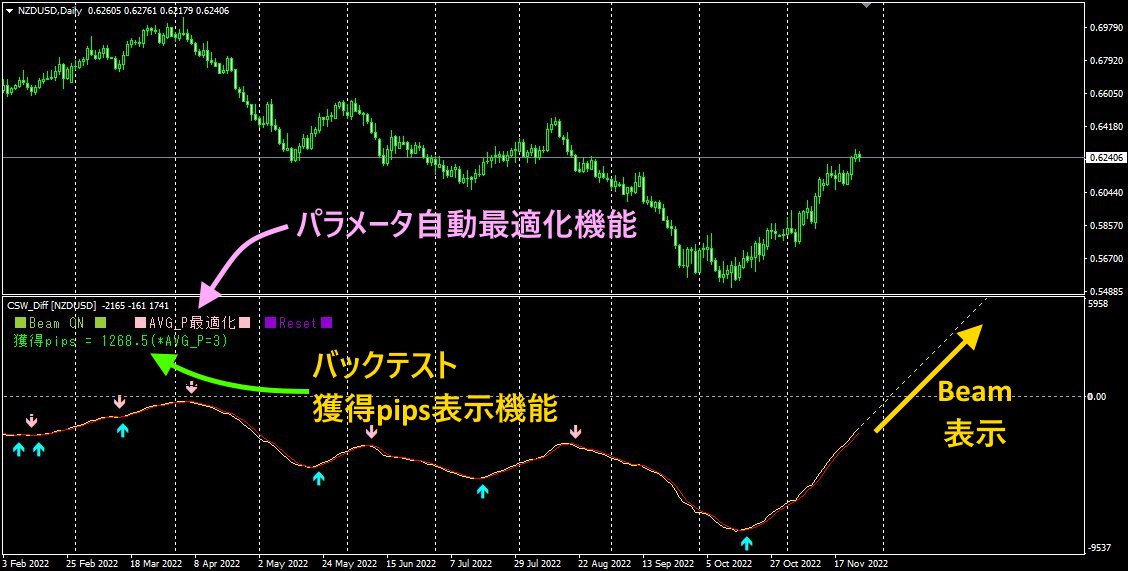
Functions of the indicator include:
(1) display function
(2) Auto-optimization of parameters
(3) Backtest gains pips display function
etc.
If you are interested, please refer to the following link.
https://www.gogojungle.co.jp/tools/indicators/41351
If you are interested in the 8C Currency Strength Visualization Indicator, please refer to the following page.
MT4 version https://www.gogojungle.co.jp/tools/indicators/39150
version https://www.gogojungle.co.jp/tools/indicators/39159
【My Items for Sale】


