

Utilization of the "Visualization Indicator" (Part 69)
Utilization of the "Visualization Indicator" (its69)
1. Evoluting the "28 Currency Pair List Indicator" into an advanced indicator
“8CP Visualization Indicator” to plotAUDUSD.
The “8CP Visualization Indicator” includesOceania version,London version,NewYork version,AnyCP version. This time, theOceania version was used.
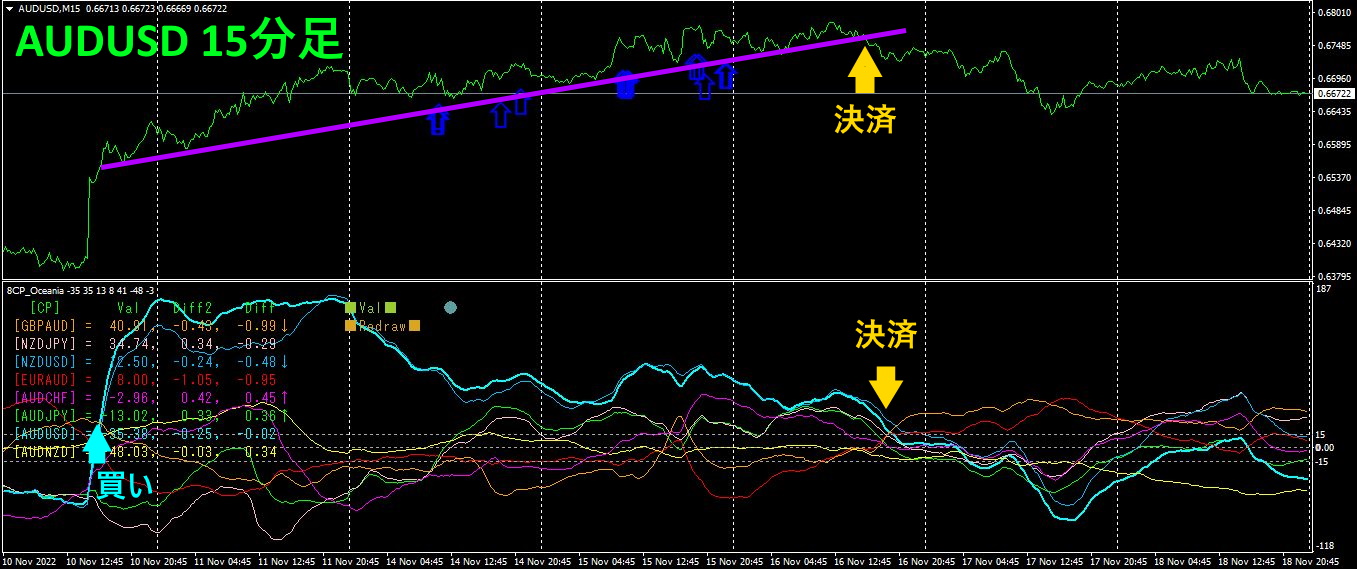
The upper half is the 15-minute chart ofAUDUSD. The light blue arrow in the upper half indicates the alert position of the “28 Currency Pair List Indicator”. The lower half is the “8CP Visualization Indicator.” The blue thick line graph corresponds toAUDUSD.
On November month10 day, a sudden rise created a buy position, and on11 month16 day, it closed for more than200pipsAUDUSD graph closes when below the threshold or when the price breaks an upward trend line.
2. Best Select Try the indicator
The following image is a screenshot taken at2022 year11 month15 day22:40 (JST).
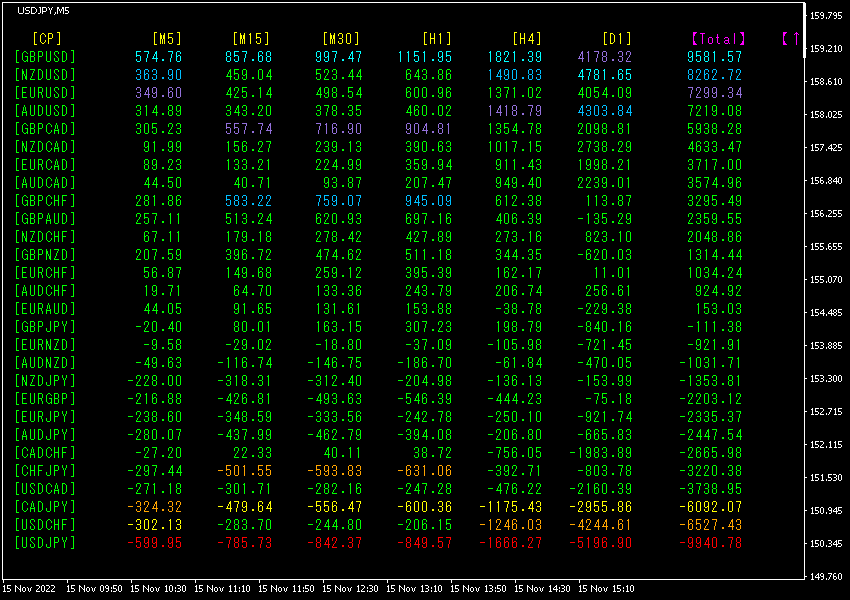
Total values are sorted in descending order. The topmost row showsGBPUSD, [D1] is excluded, and the numbers in the columns [M5][M15][M30][H1][H4][D1][Total] are displayed in light blue, with theTotal value also shown as9581.57 indicating a large positive value. This shows GBPUSD had a strong uptrend. Also, the bottom row USDJPY has all the numbers in red for [M5][M15][M30][H1][H4][D1][Total], and the Total value is-9940.78, indicating a strong negative value. This indicates USDJPY had a strong downtrend.USDJPY.
There was a news release (U.S. Producer Price Index) at 22:30 (Japan time) on November 15, which likely impacted the rates of GBPUSD and USDJPY.
Now, let's look at the charts of GBPUSD and USDJPY.
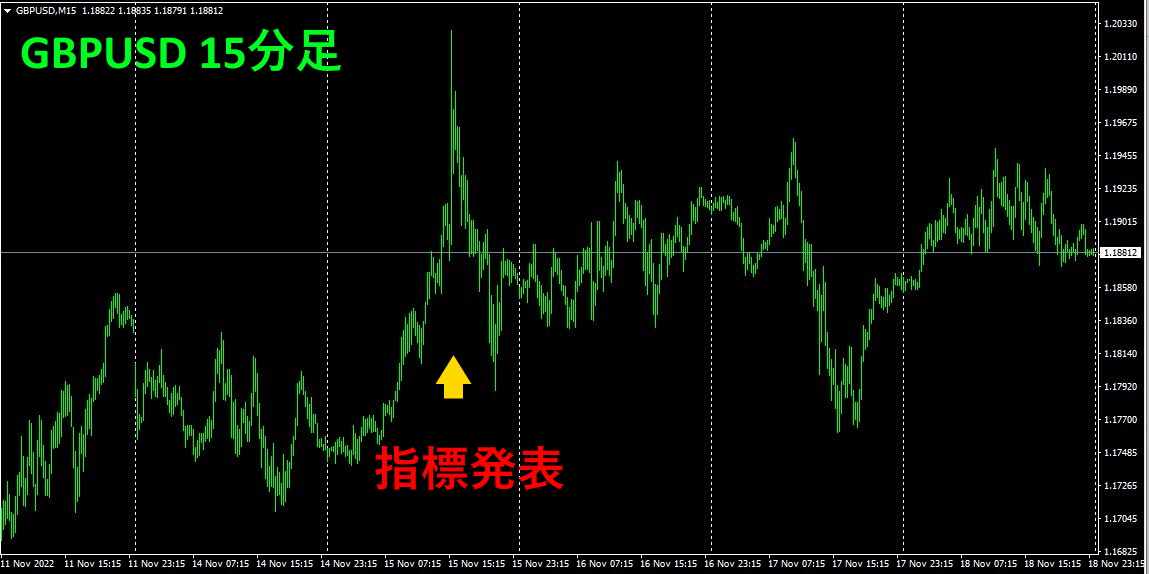
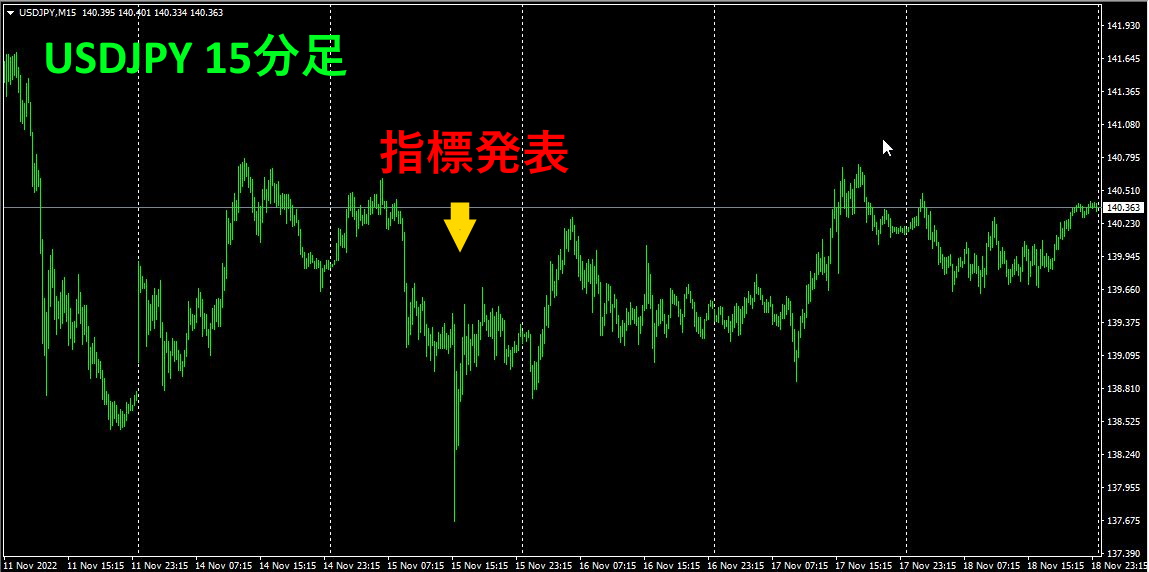
Following the data release, both moved sharply but soon returned to their previous levels.
3. What happened to EURJPY, which has been tracked since last May?
From May 2021 year May, we have been following EURJPY.
To view the overall trend, a 30-minute chart covering roughly the last three weeks is drawn.
Last time I wrote the following:
EUR is nearly flat,JPY is rising significantly. As a result,EURJPY is expected to decline.
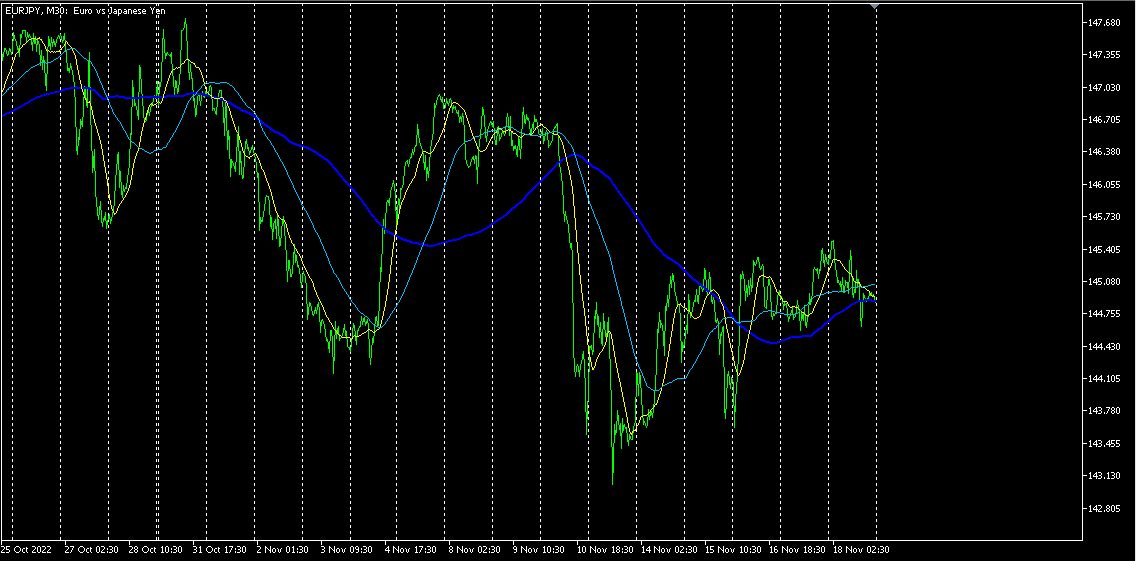
Two weeks ago, there was a move to recover the recent plunge, but upside seems heavy.
4Refer to the currency strength chart on an hourly basis.
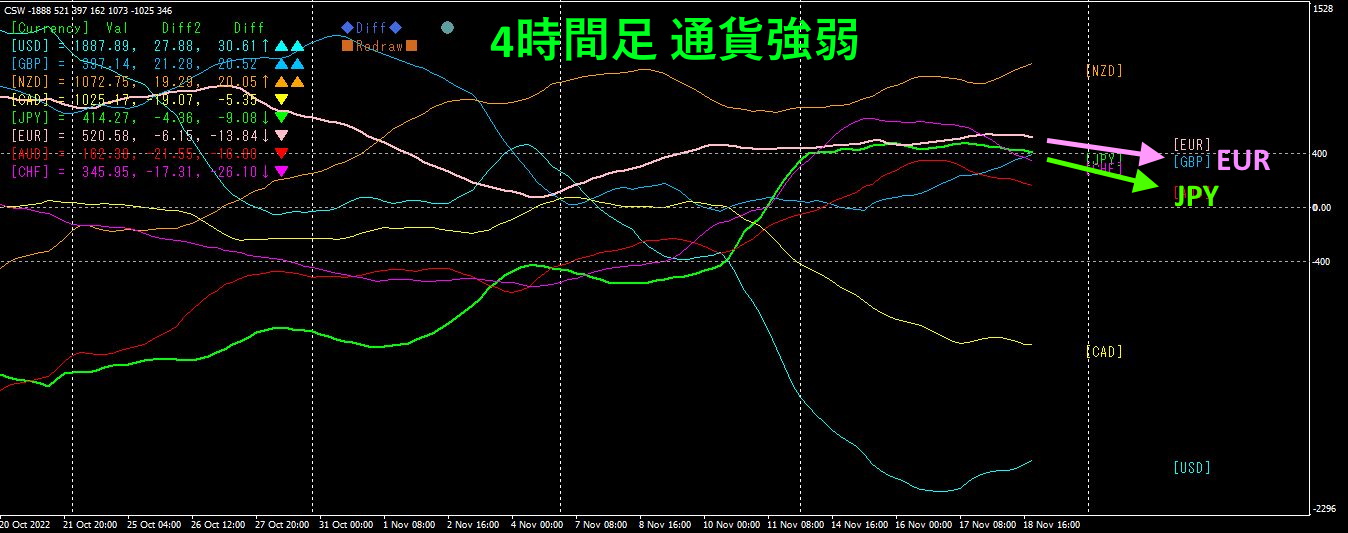
Pink isEUR, green isJPY. In terms of currency strength,EUR andJPY have roughly the same strength, and the direction is thatEUR slightly downward,JPY also downward, but the downtrend appears stronger forEUR.
is likely to move slightly upward.
If you are interested in the “8C” currency strength visualization indicator, please refer to the following page.
MT4 version https://www.gogojungle.co.jp/tools/indicators/39150
MT5 version https://www.gogojungle.co.jp/tools/indicators/39159
【Products I have for sale】


