

Utilization of "Visualization Indicators" (Part 66)
"Visualization Indicator" utilization (part66)
1. Further evolve the "28 Currency Pair List Indicator" into an indicator
"8CP Visualization Indicator"to plotGBPUSD.
The "8CP Visualization Indicator" includesOceania version,London version,NewYork version,AnyCP version. This time, I used theLondon version.
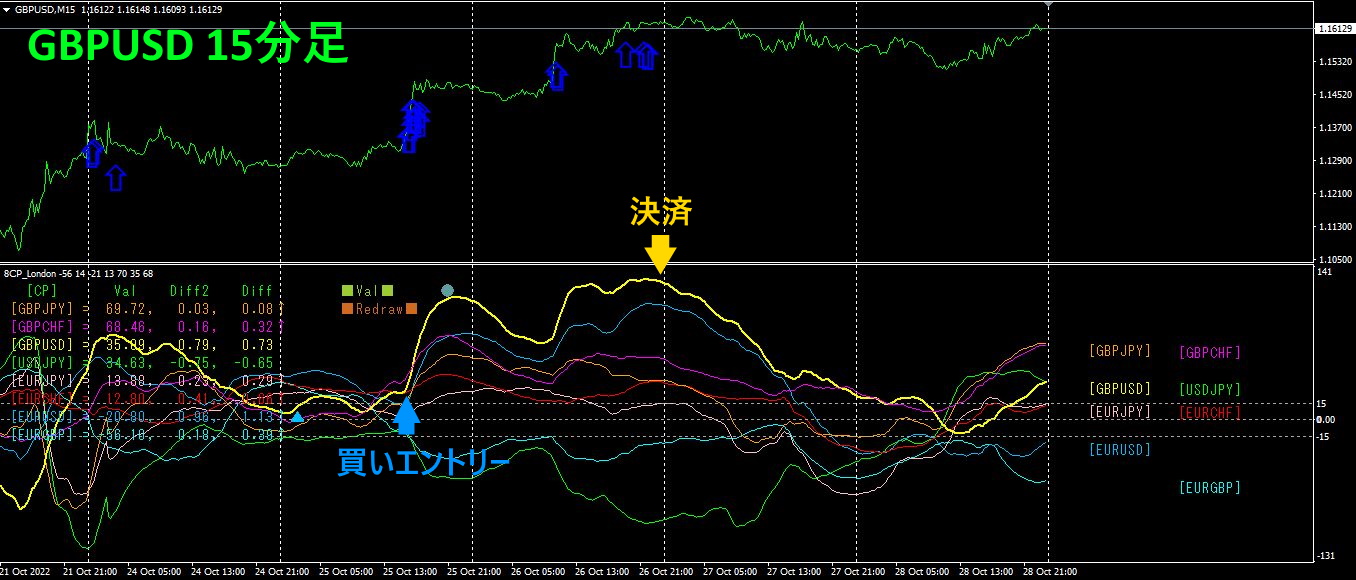
The top half is theGBPUSD 15-minute chart. The light blue arrows on the top half indicate the alert positions of the28 Currency Pair List Indicator. The bottom half is the "8CP Visualization Indicator." The yellow thick-line graph corresponds toGBPUSD.
If you buy on Tuesday and close on Thursday, you would have gained about260pips profit.
2. Best Select Try the Indicator
The following figure is a screenshot taken on2022 year10 month28 day 20:13 (JST).
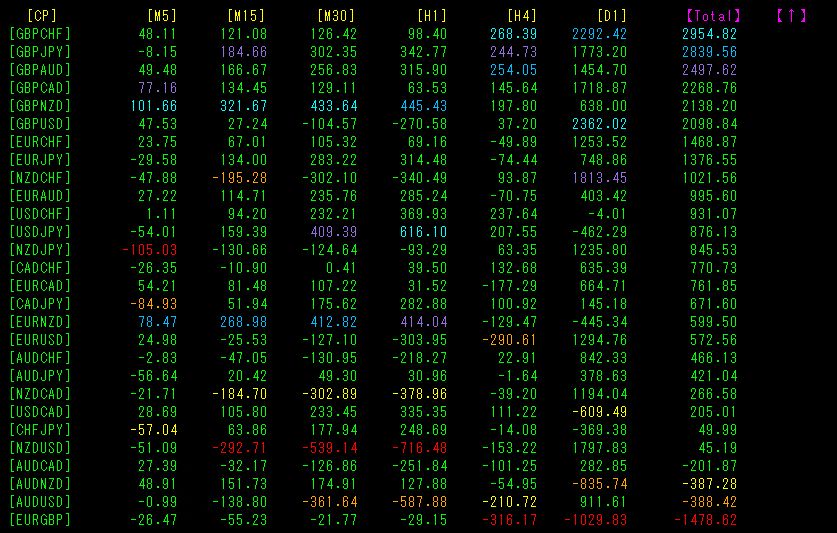
Total values sorted in descending order. The numbers are not large, and the color display is varied, so no pronounced trend is evident. This week, there were no alerts.
3. Since last year5 month, what happened withEURJPY movement?
Since May 2021, we have been trackingEURJPY movements.
To see the overall trend, a30-minute chart showing roughly the last3 weeks is depicted.
Previously, I wrote the following.
EUR is flat to slightly downward,JPY has been falling, but due to currency intervention it rose. Since the effectiveness of intervention is unclear, it is hard to read the direction.
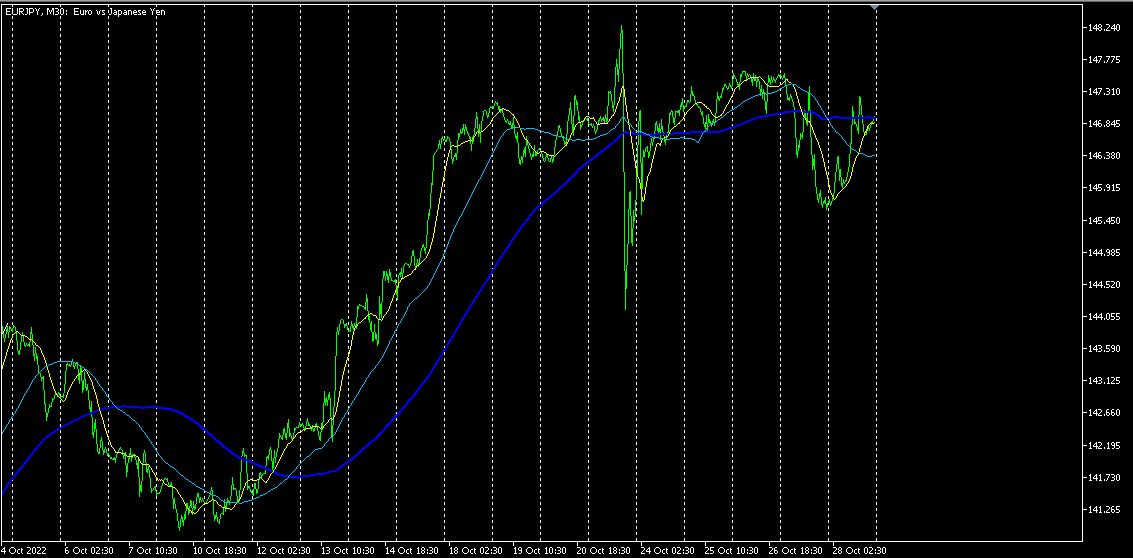
The moving average (SMA200) is flat.
4Let's refer to the time-frame currency strength chart.
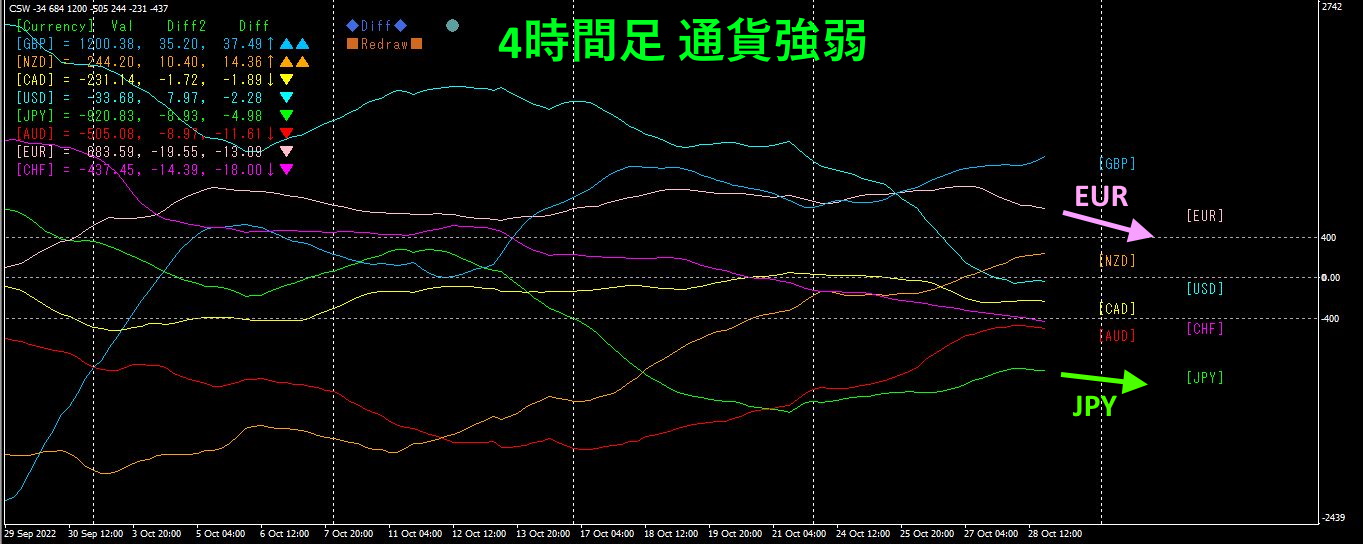
Pink isEUR, green isJPY.EUR is flat to downward,JPY is slightly downward. ComparingEUR andJPY,EUR shows a stronger downward trend. As a result,EURJPY is expected to fall slightly, but given the significant influence of currency interventions, certainty is elusive.
4. Profiting safely from large moves caused by currency interventions
EURJPY 30minute chart, with visualized indicatorAnyCP version (currency pairs set to,EURJPY,USDJPY,EURUSD
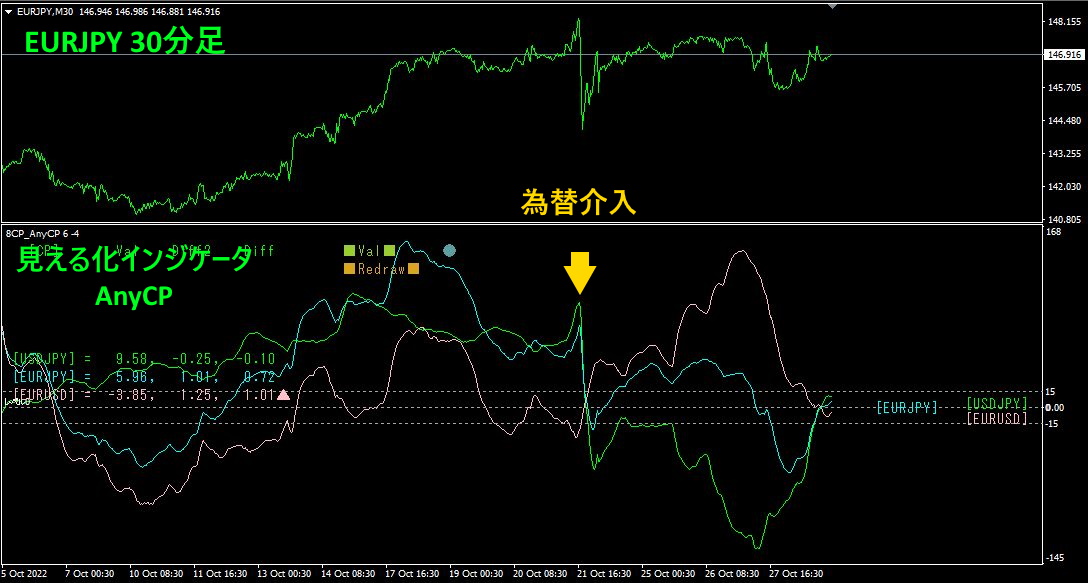
The lower half's green graph isUSJPY. This shows that the effect of currency intervention has dissipated, returning close to the original state. From this chart, you can read various signals, such as when intervention causesUSDJPY to fall andEURUSD
For example, since USDJPY and EURUSD move inversely, what would have happened if, from 10月 28 day 18:00, you bought USDJPY and sold EURUSD?
USDJPY EURUSD
月日146.050 1.00774
10月日147.674 0.99328
pipsspread+162.4 -144.6
Total,307pips of profit.
If you are interested in the "8C Currency Strength Visualization Indicator," please refer to the following page.
MT4 version https://www.gogojungle.co.jp/tools/indicators/39150
MT5 version https://www.gogojungle.co.jp/tools/indicators/39159
【My products for sale】


