

Utilization of the “Visualization Indicator” (Part 65)
Utilization of “Visualization Indicator” (its)65)
1. Further development of the “28 Currency Pairs List Indicator” and the indicator
“8 CP Visualization Indicator” for NZDJPYto draw
“8 CP Visualization Indicator”forOceania version,London version,New York version,AnyCP Oceania
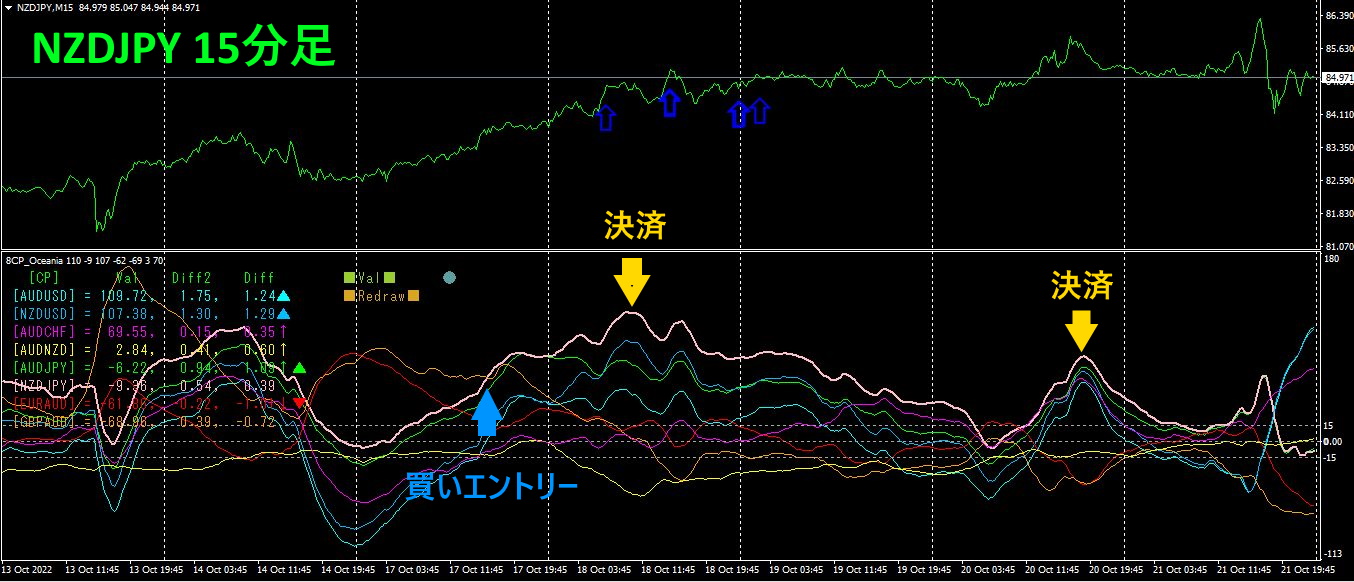
The top half is theNZDJPY 15-minute chart. The light blue arrows in the top half indicate the alert positions of the “28 Currency Pairs List Indicator.” The bottom half is the “8 CP Visualization Indicator.” The pink graph corresponds to.
If you bought on Monday and closed on Tuesday,about140 pips of profit, and if closed on Thursday,about210 pips of profit was obtained.
2. Best SelectTry the indicator
The following figure is a screenshot taken atOctober 2022, 14:30 (JST) date.
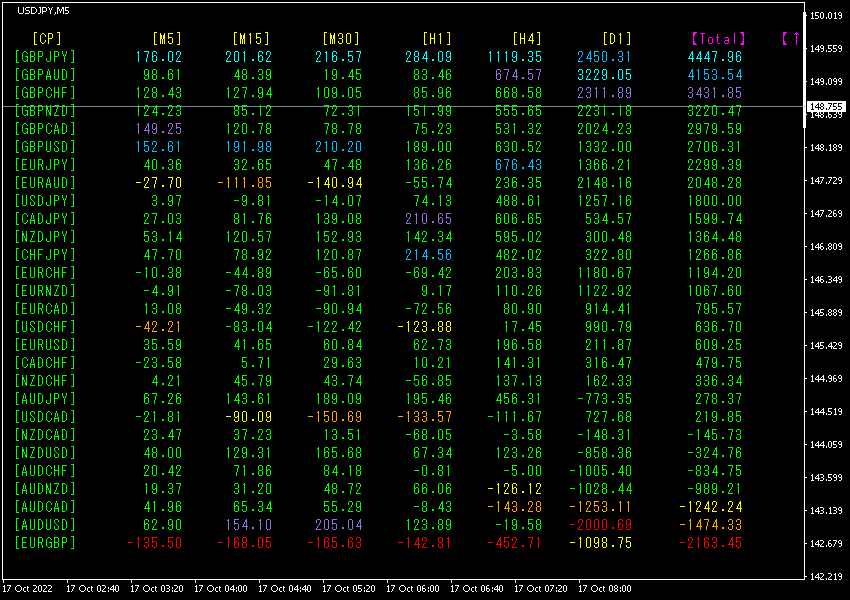
TotalNumbers are sorted in descending order. The top row containsGBPJPY,,
[M15],[M30],[H1],[H4],[Total] is shown in light blue, and [D1] is shown in blue.Total value is4447.96, indicating a strong uptrend in GBPJPY.
On the other hand, the bottom line showsEURGBP in red hues.
Now, let’s look at the GBPJPY graph.
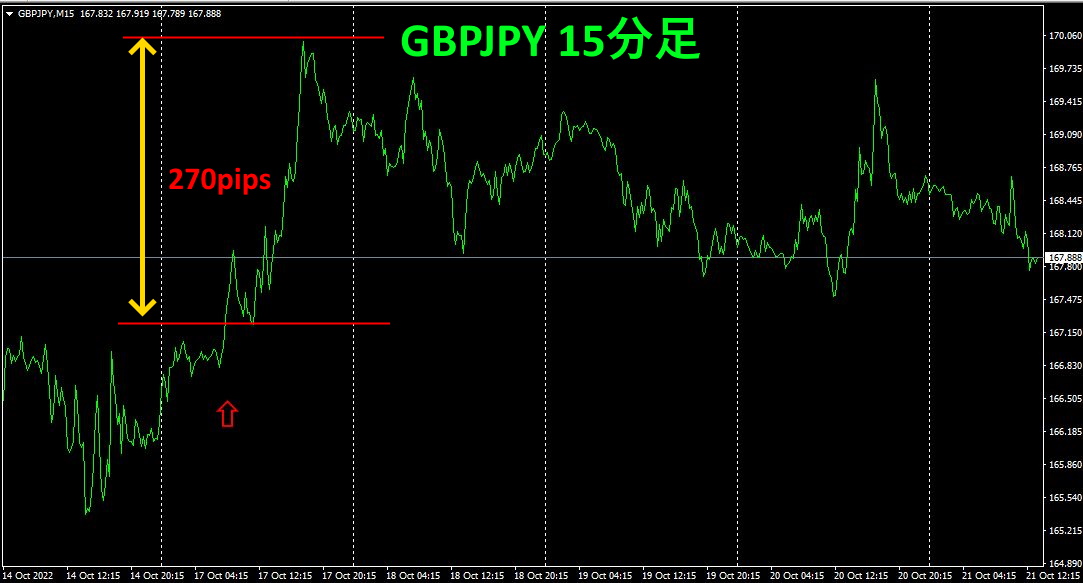
The above figure is the GBPJPY 15-minute chart. The red vertical line marks the position where the screenshot was taken. If you bought here, you could have gained about270 pips of profit.270 pips of profit.
Next is the EURGBP 15-minute chart.
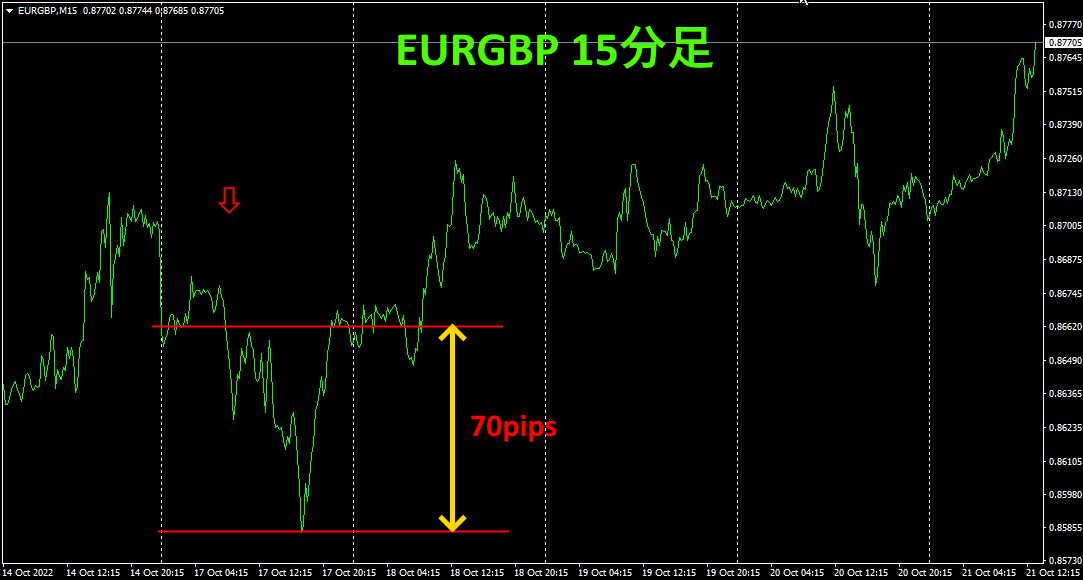
About70 pips of profit were obtained.
3. What happened to EURJPY, which I have been tracking since May of last year?
Since May,2021,I have been tracking EURJPY.
To view the overall trend, I have drawn about three weeks of data on a 30-minute chart.
Previously, I wrote the following.
EUR shows a horizontal to slightly upward movement, is moving downward and declining. (The pace of yen depreciation does not stop.) As a result, is expected to move higher.
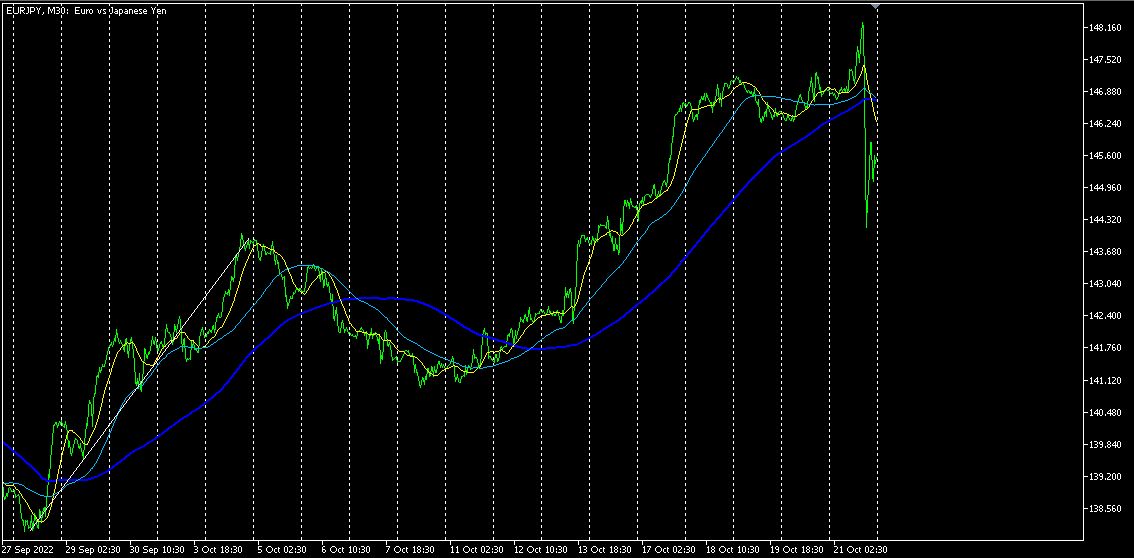
As predicted previously, it rose. It formed a clean pattern.
It plummeted due to weekend currency intervention.
4Refer to the 4-hour chart for currency strength.
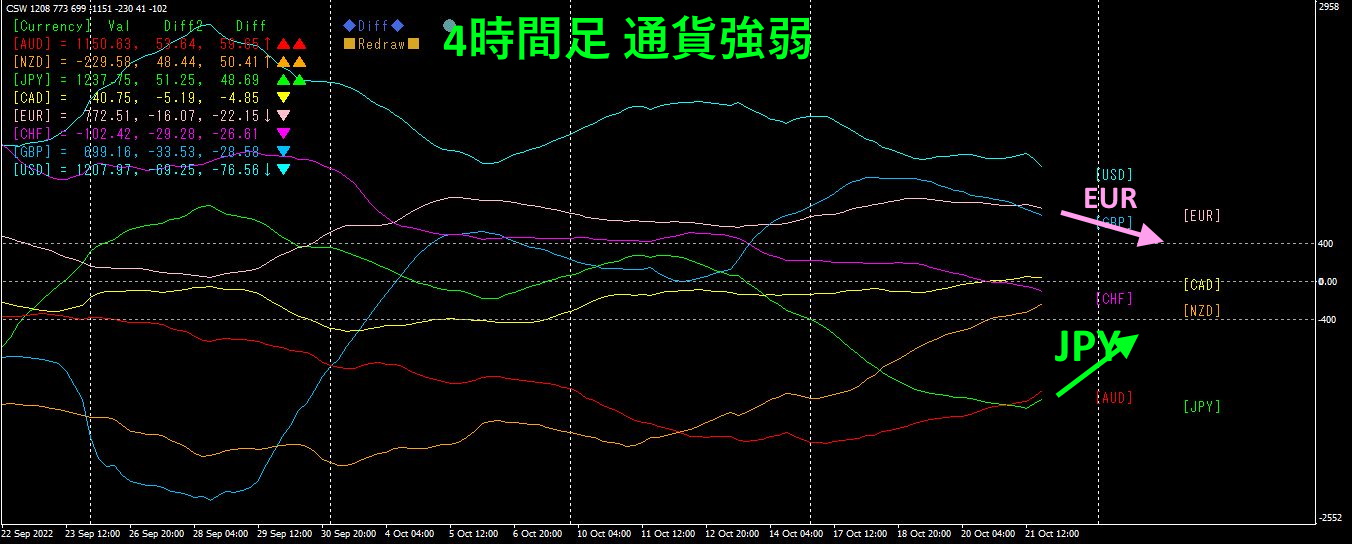
Pink indicates, green indicates. moved slightly downward from horizontal, declined, but due to intervention, moved upward. Since it is unclear how effective intervention will be, the direction is uncertain. However, the general trend toward a weaker yen is not likely to change solely due to a single intervention, and it is natural for it to revert after a while.
If you are interested in the “8C Currency Strength Visualization Indicator,” please refer to the following page.
MT4 version https://www.gogojungle.co.jp/tools/indicators/39150
MT5 version https://www.gogojungle.co.jp/tools/indicators/39159
【My products for sale】


