

Utilization of the "Visualization Indicator" (Part 64)
Utilization of the "Visualization Indicator" (Part64)
1. Further evolve the "28 Currency Pairs List Indicator" into an indicator
"8CPVisualization Indicator"to plotGBPAUD.
The "8CPVisualization Indicator" includesOceania version,London version,NewYork version,AnyCP version. This time, I used theOceania version.
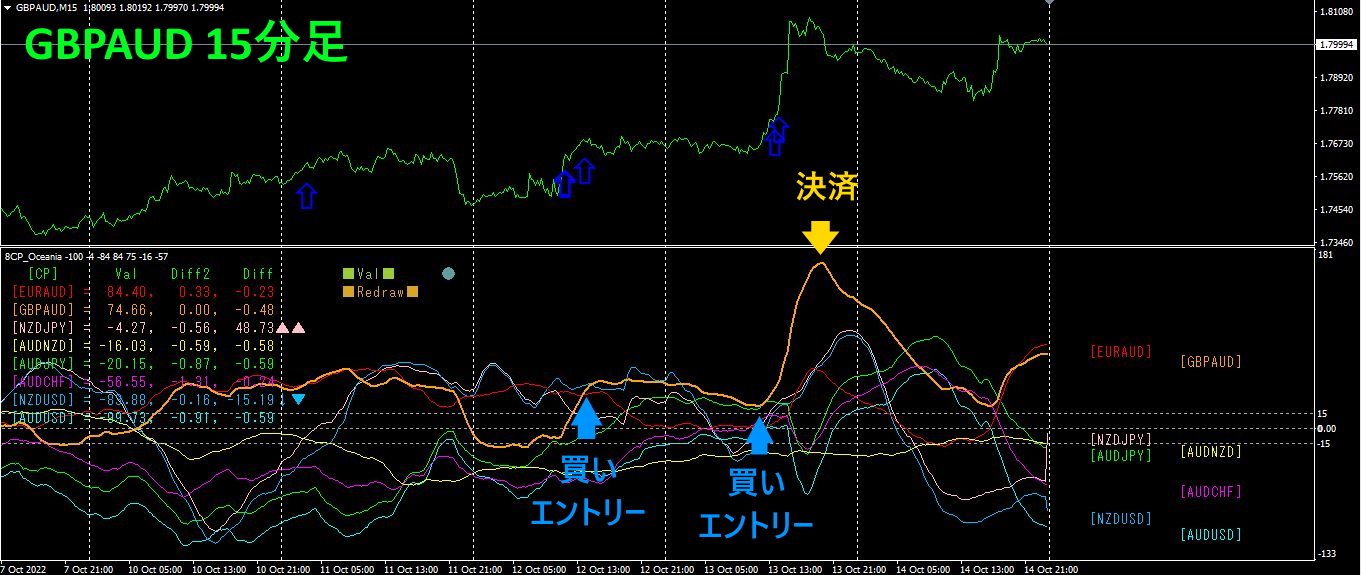
The top half is a 15-minute chart ofGBPAUD. The light blue arrow in the top half indicates the alert position of the "28 Currency Pairs List Indicator". The bottom half is the "8CPVisualization Indicator". The orange graph corresponds toGBPAUD.
I opened a long position on Wednesday and closed it on Thursday for a profit ofabout400 pips..
2. Best SelectTry the indicator
The following figure is a screenshot taken at2022 year10 month11 day12:39 (JST).
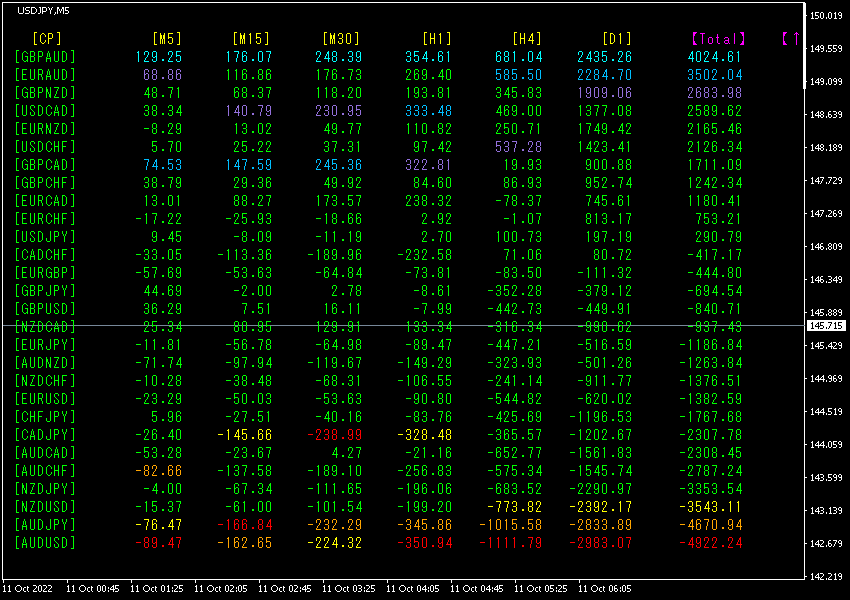
Number of items sorted in descending order. At the very top row,GBPAUD is[M5],
[M15],[M30],[H1],[H4],"D1"],[Total]are all highlighted in light blue.The value of Total is4024.61, indicating a strong uptrend in GBPAUD.GBPAUD shows strong upward movement.
On the other hand, the bottom line forAUDUSD is in red tones. This indicates a downtrend for AUDUSD. It seems theAUD
Now, let's look at the currency strength graph.
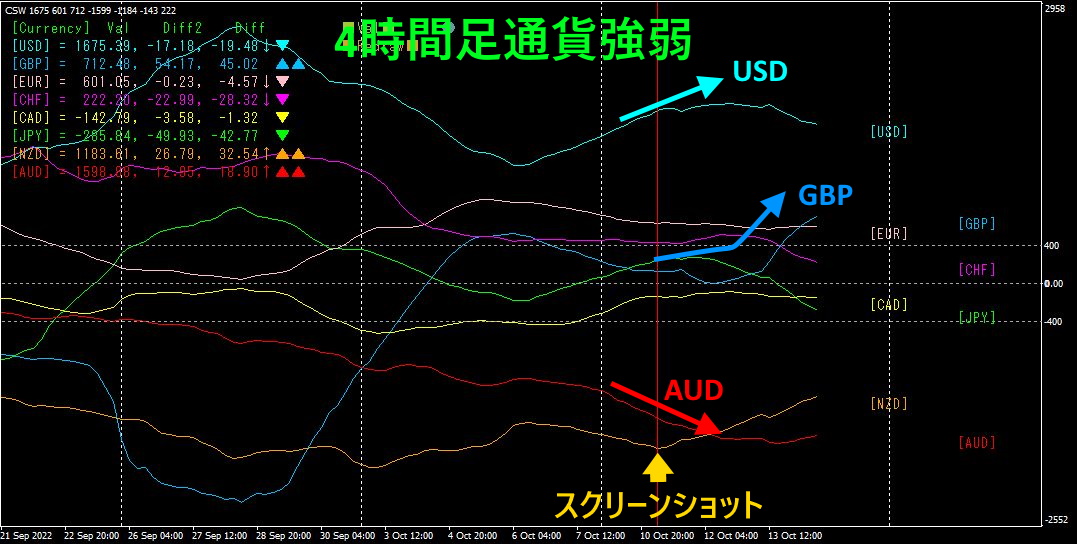
The above figure shows the 4-hour currency strength graph. The red vertical line marks where the screenshot was taken. Indeed,AUD is weak and trending downward.USD is the strongest and rising,GBP is generally upward as well.GBPAUD rises,AUDUSD falls, reflecting the relative strength difference between currencies.
3. Since May last year EURJPY has moved?
From May2021, EURJPY has been tracked.
To view the overall trend,30-minute chart shows about3 weeks of data.
Previously, I wrote as follows.
In the latter half of the week,EUR trended downward,JPY trended upward. If this trend continues,EURJPY is expected to move downward.
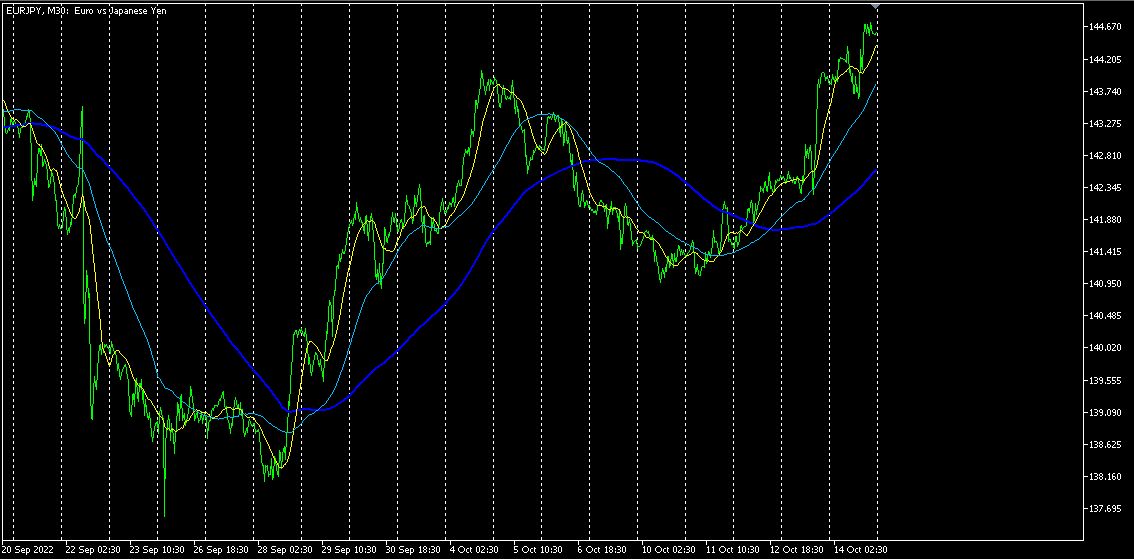
In the first half of the week, it declined as expected. After that, it turned upward again.
4Refer to the 4-hour currency strength chart.
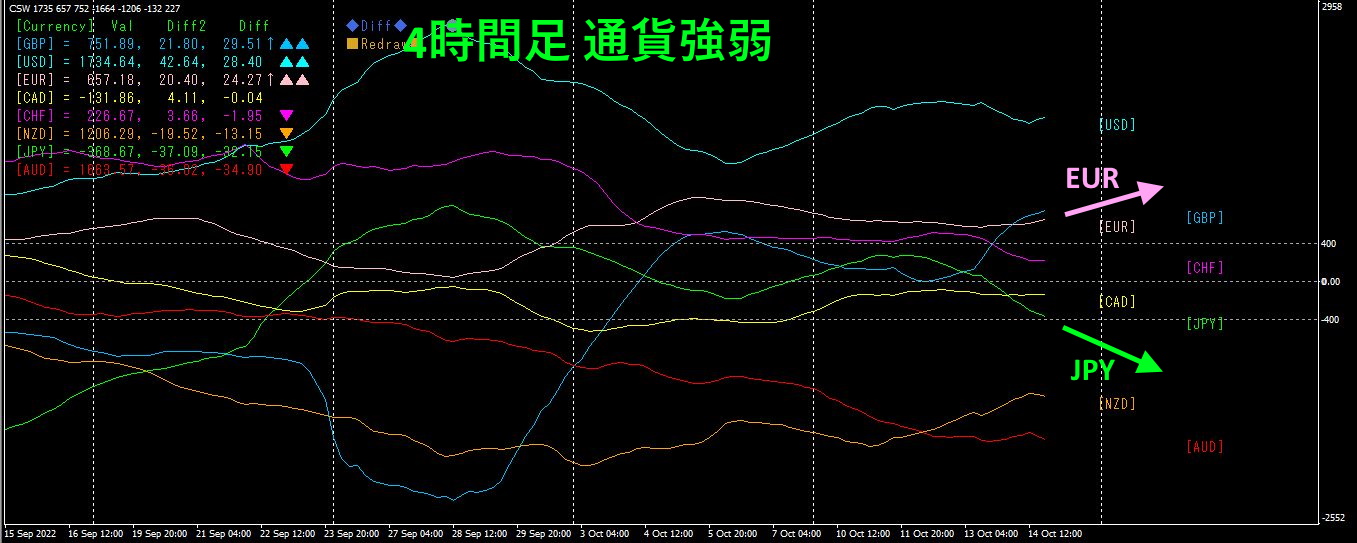
Pink representsEUR, green representsJPY.EUR is moving slightly upward from a horizontal level,JPY is moving downward and declining. (The yen's weakness shows no sign of stopping.) As a result,EURJPY is expected to move upward.
If you are interested in the "8C currency strength visualization indicator, please refer to the following page.
MT4 version https://www.gogojungle.co.jp/tools/indicators/39150
MT5 version https://www.gogojungle.co.jp/tools/indicators/39159
【Items I have for sale】


