

20180305号-lite (Daily Foreign Exchange News)
Hello! This is MK fund.
Today, unlike before, we will publish analyses for each timeframe (*^^*)!
Please also check our daily forex newspaper e-version with analysis chart images.
1h, while being held down by the conversion line
the wave moves to the right and makes new lows repeatedly
a development where the downtrend continues but rebounds.
Pay attention to the conversion line, the baseline, and the wave line as support/resistance
and the lagging span price position
the wave moves to the right and makes new lows repeatedly
a development where the downtrend continues but rebounds.
Pay attention to the conversion line, the baseline, and the wave line as support/resistance
and the lagging span price position
4h, after a decline along the lagging span price, the price also breaks below the cloud
after the decline, breaking below the cloud, entering a downtrend,
and the previous low is also breached.
Recently, a rebound has formed, but from the body’s S point
a retracement up to 23.6% is in view, while continuing the downtrend
as we chase the downtrend, we also set up for a convergence reversal.
8h, the up-move breaks below, from the cloud resistance
the price crosses downward along the lagging span turning line
and a downtrend has begun.
We gauge the momentum with the wave line and
pursue the downtrend.
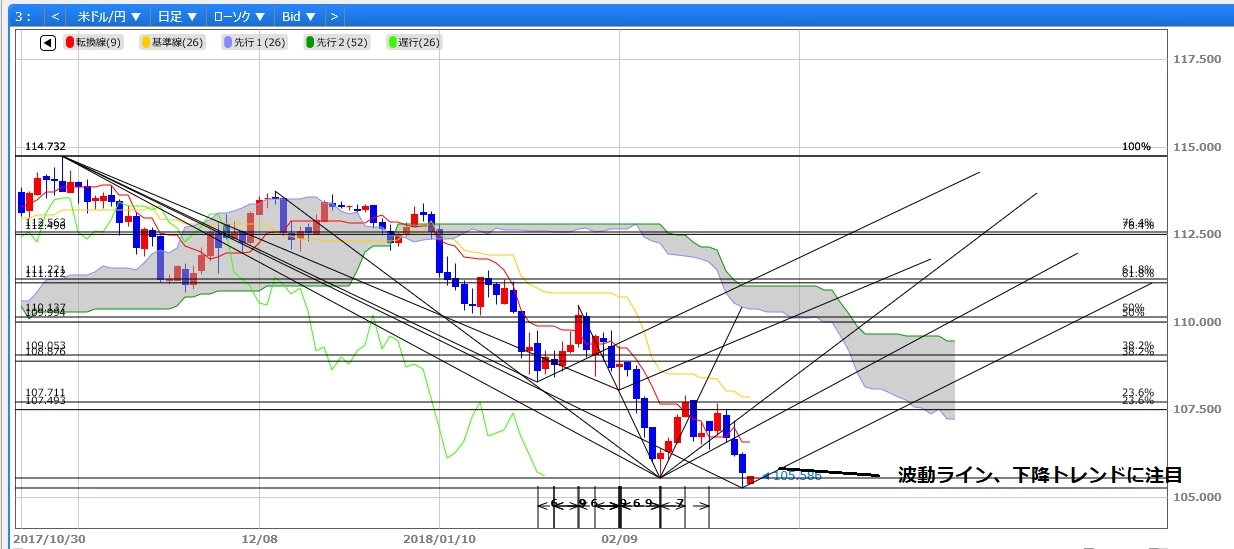
Daily, from the downtrend to around 23.6%
after a rebound
the conversion line falls below as the downtrend continues again
in this setup.
Chasing the downtrend and aiming for a convergence reversal.
Focus on the lows, the previous lows, and the wave line.
Weeklyafter rising toward the lagging span price vicinity
it is again moving downward.
Wave line, low range,
pay attention to the position of the previous high/low.
Also watch for the 26th change date.
it is again moving downward.
Wave line, low range,
pay attention to the position of the previous high/low.
Also watch for the 26th change date.
Monthly, with the price moving from the market level, the baseline,
the conversion line also breaks below, continuing downward.
It temporarily retraces to the baseline but faces resistance and declines,
the month changes around the 38.2% level.
Be cautious of a potential upside reversal at month-end.
From the recent low range, a support around 23.6%
breaching it
along the lagging span price decline,
a drop down to 50% below the cloud is in sight.
Pay attention to Fibonacci lines and the low range.
A downtrend is forming.
While watching for a reversal from the weekly change date,
the rebound position of the downtrend is aligned with multi-timeframe
resistance positions and we will act accordingly.
We will pursue the downtrend.
While watching for a reversal from the weekly change date,
the rebound position of the downtrend is aligned with multi-timeframe
resistance positions and we will act accordingly.
We will pursue the downtrend.
We also aim for a convergence reversal at the wave line.
If the reversal occurs at the monthly change date and the weekly change-date function rises
the 1h baseline, lagging span price, cloud resistance,
the 4h 23.6%, the conversion line, the baseline, the cloud, and the lagging span price resistance
the 8h conversion line, baseline, lagging span price band resistance
the daily baseline, S points, 23.6%, and baseline resistance
the weekly previous wave line, S-point breakout above resistance
in line with the rising cycle of lagging-span price on the weekly,
toward the monthly market level in an upward scenario.
If this continues, a long-term downtrend may prevail.
In that case, the 1h latest upward wave line, the low-range support
the 4h latest upward wave line, the low-range support
the 8h latest upward wave line, the low-range support
the daily latest upward wave line, the low-range support
the weekly upward wave line, the low range and S-point support break below
the daily downtrend continues from here
moving downward toward 76.4% on the weekly and 50% cloud below on the monthly
a scenario of further decline.
With the multi-timeframe support/resistance function
a scenario of range-bound movement around the 23.6% level on the monthly
a scenario of range-bound movement around the 23.6% level on the monthly
We will follow the direction by aligning multi-timeframe support/resistance.
(Sample: Daily)
A portion of the “Forex Newspaper Electronic Edition” (delivered Sun–Thu) that MK fund broadcasts with favorable reception is published here!
The content includes entry rationale and key lines, with images and explanations in detail.
We also offer a free trial campaign, so please see the introduction page. (Samples can also be viewed here.)
In addition, we provide various analysis content services that aid analysis.
Would you like to incorporate time analyses and price-range observation theories into your analysis?
It will surely improve the accuracy of entries.
Introduction page: http://mk-fund.com/lp
Website: http://mk-fund.com
× ![]()