
Romatz 225 [Moving Average and Time-of-Day Analysis Method] Practical Edition
Nikkei 225 Basics
Introduction
Hello, this is Information Manual. Thank you very much for your interest in our product. First, please review the following points before reading this manual. Note that this content is composed of four parts: Nikkei 225 Basics, Theory Explanation, Practical Chart, and Practical Auto-Trading. Outside of the Basics, access is password-protected for purchasers only. Please understand this in advance.
General
Purpose
Introduction of a method that enables advantageous trading in Nikkei 225 futures
Instruments
Nikkei 225 Futures (mini)
(Contract months are the near-month of the Large contract: March, June, September, December)
Development Concept
- Be able to interpret the chart intuitively with few indicators
- Support automated trading using AutoRe225 Cloud Service
- Be a fundamentally sustainable method for future use
- Remain within a range where you can keep your mindset even if temporary losses occur
- Not use high-risk methods like averaging down or low-level methods such as hedging
Notes
Copyright
This book is protected by copyright law. Please strictly observe the following when handling it.
- Unauthorized reproduction, reuse, or resale by any means is prohibited.
- Reproduction is allowed only for non-commercial, personal use.
However, please ensure that a third party cannot view it.
Financial Risk
This logic introduces a method for advantageous trading but does not guarantee future profits. If you incur losses, it is your own responsibility, so please make the final judgment yourself.
Nikkei 225 Futures
Nikkei 225 futures are derivative trades based on the Nikkei 225 stock average as the underlying asset and are listed on the Osaka Exchange and others.
Instruments Types
There are Nikkei 225 Futures (Large) and Nikkei 225 Mini, with the Mini being one-tenth the size of the Large. Individual investors with limited funds commonly trade Minis. The main differences are shown in the table below.
| Type | Tick Size | Contract Size | Months | Margin |
|---|---|---|---|---|
| Large | 100 yen | 10,000 yen | Multiples of 3 months | Approximately 1.5 million yen |
| Mini | 50 yen | 500 yen | Every month | Approximately 150,000 yen |
Margins are always fluctuating. Usually they are about 5–6 times the stock price.
Trading Hours and Trading Days
The trading day for Nikkei 225 futures starts from 16:30 on the previous business day.
| Category | Open to Close | Time |
|---|---|---|
| Daytime | 8:45-15:15 | 6 hours 30 minutes |
| Night Session | Prev 16:30-6:00 | 13 hours 30 minutes |
| Trading Days | Prev 16:30-15:15 | 20 hours |
Daytime is also called the regular session, and nighttime is also called the after-hours session.
Characteristics
Nikkei 225 futures have the following characteristics and can be relatively approachable trading instruments.
- No need to select specific stocks or currency pairs as with stocks or FX.
- Unlike physical stocks, you can profit when prices go down.
- Commissions are so low that a small profit per tick can cover costs.
- There are few unexplainable price wicks as with FX.
Although the mechanism is easy to understand, not everyone can make money. Trading is a zero-sum game, meaning the total of profits and losses is zero. If many professionals are winning, many amateurs will be losing. To become a winner, you need to acquire a correct trading method.
Terminology and Charts
Here we explain commonly used trading terms and charts.
Four Price Data and Candlesticks
Four Price Data
Open, High, Low, and Close are the four values.
| Four Price Data | Meaning |
|---|---|
| Open | Value at the start of the unit time (candle) |
| High | Highest value within the unit time (candle) |
| Low | Lowest value within the unit time (candle) |
| Close | Value at the end of the unit time (candle) |
Candlestick
Graphical representation of the four price data for charts.
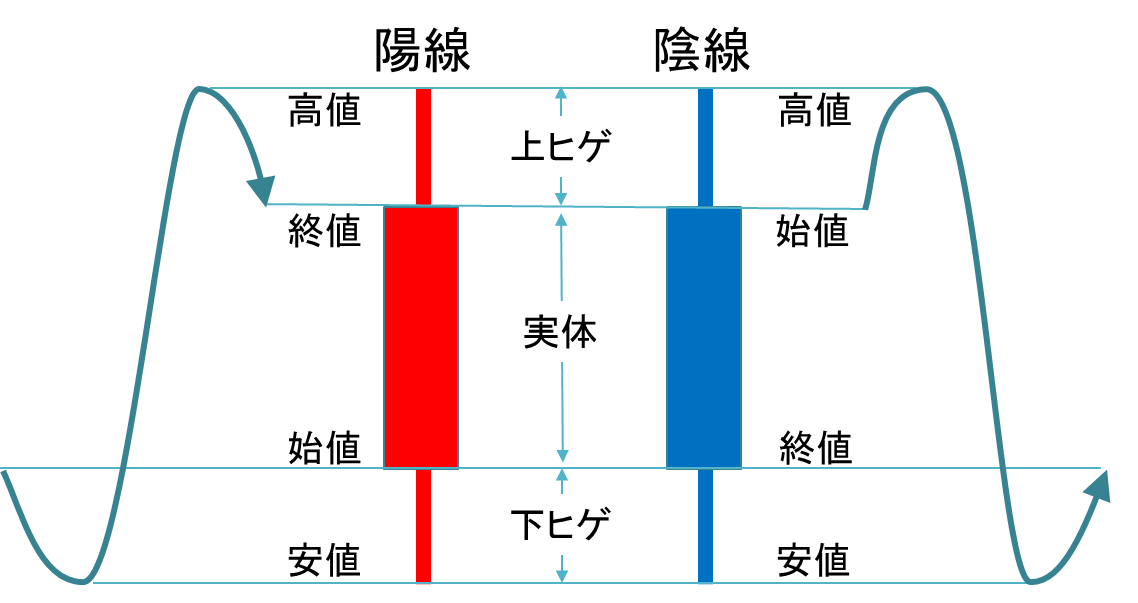
| Type | Meaning |
|---|---|
| Bullish (white/green) | Close higher than open |
| Bearish (black/red) | Close lower than open |
Charts and Technical Indicators
Charts
A graphical representation of price movements over time.
Technical Indicators
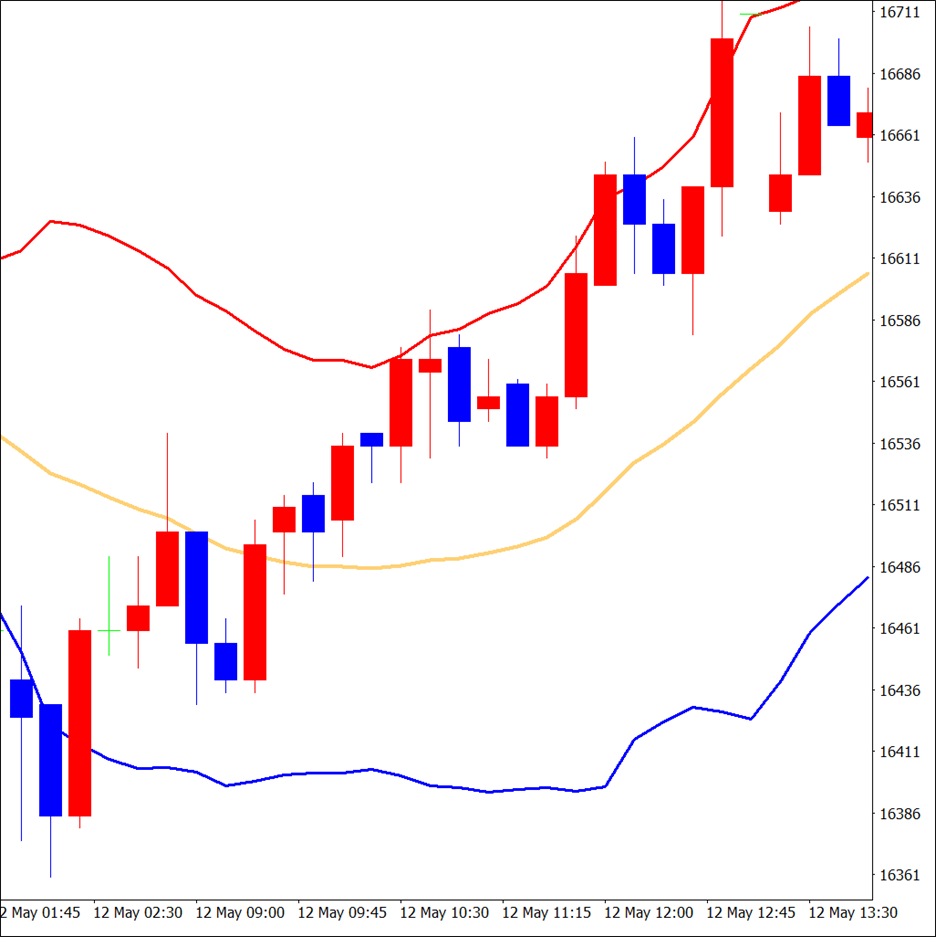
Indicators such as moving averages and Bollinger Bands analyze past price movements to predict future movements, also called indicators.
Moving Average (orange line on charts)
Average of past closing prices over a fixed period
There are simple, weighted, and exponential moving averages; this book uses the Simple Moving Average (SMA) and may simply refer to it as Moving Average (MA).
Bollinger Bands (enclosed by red and blue lines on charts)
MA over a past period ± coefficient × standard deviation (σ)
Also written as BB ± nσ, with the relationship between coefficient and probability shown in the table below.
| BB | ±0.5σ | ±1.0σ | ±1.5σ | ±2.0σ | ±2.5σ | ±3.0σ |
|---|---|---|---|---|---|---|
| Presence Probability | Approximately 38% | Approximately 68% | Approximately 86% | Approximately 95% | Approximately 99% | Approximately 100% |
The coefficient 2.0 is commonly used, and this book also uses 2.0 (95%).
Market Sense
Market sense is broadly categorized into trends and ranges, with trends having upward and downward directions.
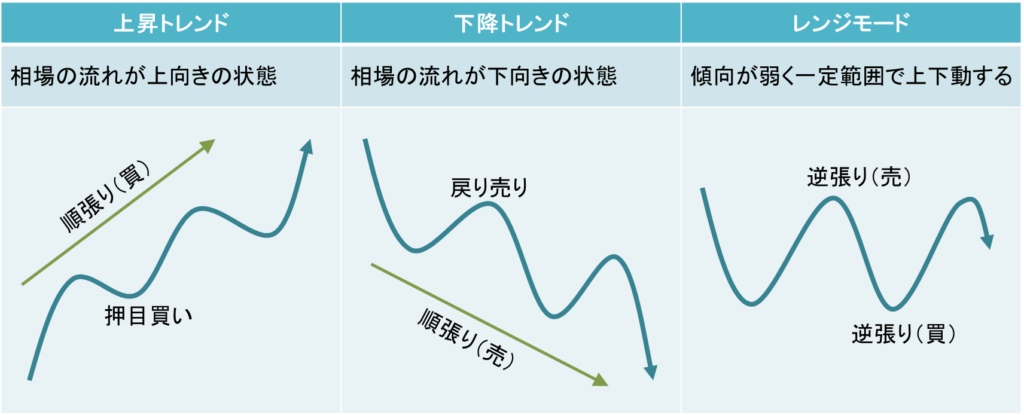
As shown in the chart, even within a trend, prices can temporarily move in the opposite direction; this is called a pullback (adjustment).
Trading Terms
Momentum Trading vs. Counter-Trend, Buy on Dips and Sell on Rallies
| Item | Content |
|---|---|
| Momentum Trading | Trade in the direction of the trend (also called trend following) |
| Counter-Trend | Trade against the trend during range modes or sharp surges/drops |
| Buy on Dips | Buy when price temporarily drops in an uptrend |
| Sell on Rallies | Sell when price temporarily rises in a downtrend |
| ※ Buy on dips and sell on rallies are long-term momentum trading and short-term counter-trend trading. |
Opening and Closing, and Price Matching Method
| Item | Content |
|---|---|
| Opening (With Limits) | When trading begins, the first price is set, or that price Daytime opening (08:45), Night opening (16:30) |
| Closing | The last price when trading ends, or that price Daytime close (15:15), Night close (06:00) |
| Price Matching Method | Orders placed before opening or within five minutes before closing are treated as if entered at the opening or closing time and are matched at the same price |
| ※ Since spot stocks have daytime (regular session) and after-hours sessions, there are opening and closing times for each, and the after-hours close is called the "after-hours close" in particular. |
Other Trading-Related Terms
| Item | Content |
|---|---|
| Entry | Initiating a trade (building a position, placing a lot) |
| Exit | Ending a trade (repayment, settlement, closing) |
| Execution | Trade is executed |
| Entry Price | Price at entry (entry value) |
| Position | A state where you have entered but not exited (long or short) |
| Unrealized Profit | Position is profitable but not realized |
| Unrealized Loss | Position is in loss but not realized |
| Market Order (MO) | Place an order at the market price |
| Limit Order | Place an order with a preset price |
| Stop-Linder Order (SLO) | Buy high or sell low, a reverse limit order |
| Limit Order (LO) | Profit-taking order or limit price |
| Stop Order (SO) | Limit loss, stop, reverse limit, or cut loss |
| Drawdown | Accumulated loss |
Trading Preparation
Open a Securities Account
Any securities company that handles Nikkei 225 futures is fine, but to automate trading with AutoRe225, please open an account with one of the following brokers.
- au Kabucom Securities
- Okasan Online Securities
- SBI Securities
Operating Capital
The minimum contract for Nikkei 225 futures is Mini one contract. Considering margin, accumulated losses, and potential drawdown, about 300,000 yen is the minimum operating capital.
Mindset
No one can predict the future. All you can do is forecast, and forecasts will be right sometimes and wrong other times. No matter how good a logic is, 100% accuracy does not exist. Since no one trades to lose, you cannot earn profits unless you trade better than others.
What I want to say is: always keep in mind that you will lose sometimes. Some people hate losses so much they hold onto losing positions without closing, but it is better to cut losses early and focus on the next trade, which ultimately increases your capital.
When you lose, reflect on why you lost. If there is a reason, analyze it and add or modify rules to prevent repeating the same mistake, then re-test.
The same applies when you win. If you get carried away and overtrade, you will face a backlash. It happens to everyone.
Make this method your core, build your own rules, and unwaveringly adhere to them—never forget this.
Conclusion
That marks the end of the Basics. With the foundational knowledge and preparation you've gained, you are ready to proceed to the Theory section to learn Romatz225’s specific analysis content and usage guidance.