Romatz 225【Moving Average / Time-of-Day Analysis Method】Theory Version
Nikkei 225 Basic
Introduction
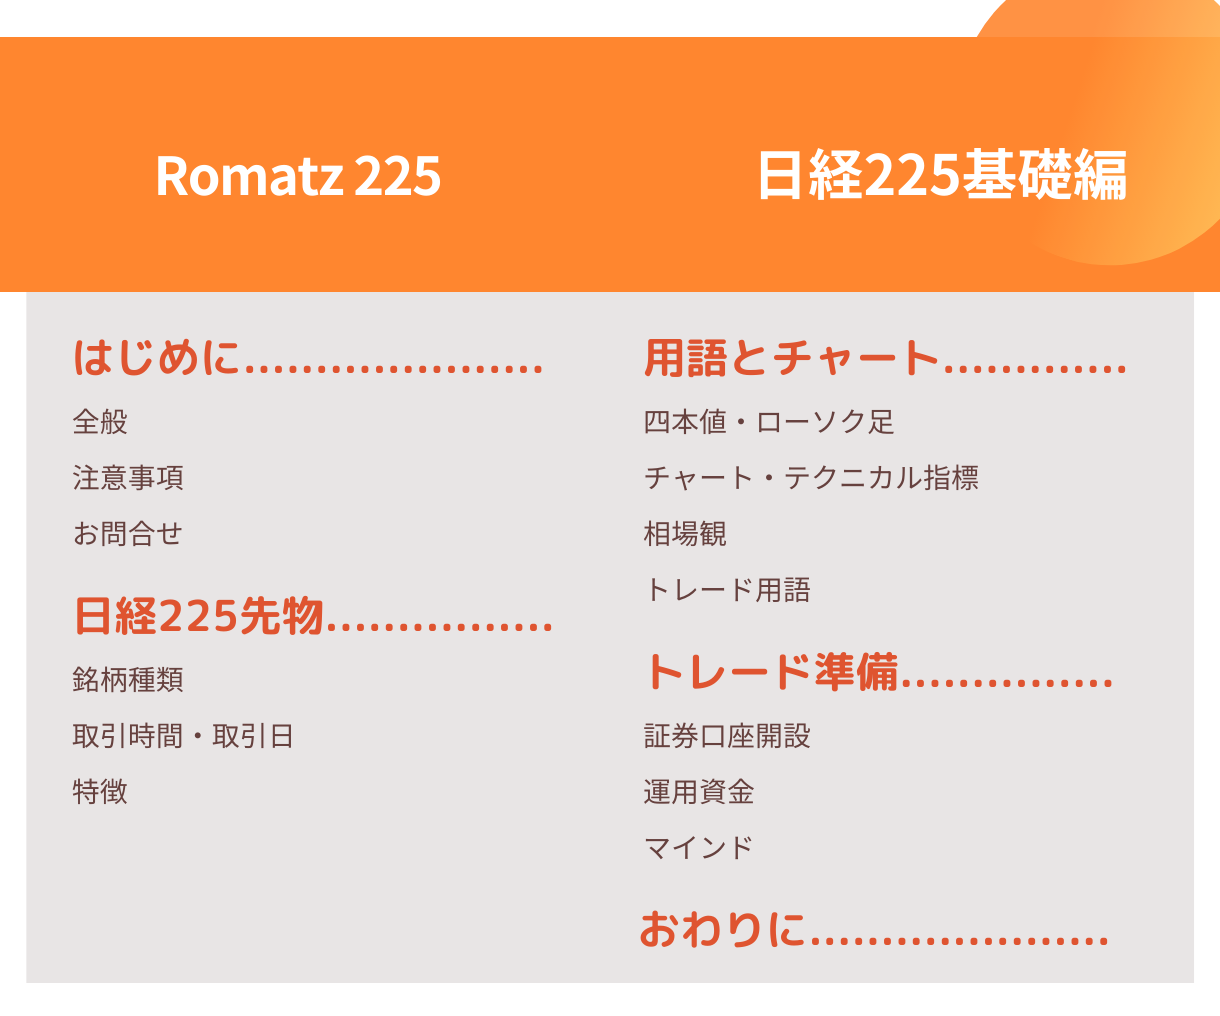
Hello, this is Information Manual. Thank you very much for your interest in our product. First, please review the following points before reading this document. Note that this content is composed of four parts: Nikkei 225 Basic, Theory Explanation, Practical Chart, and Practical Auto-Trading. Except for the Basic section, the others are password-protected and only accessible to purchasers. Please understand this in advance.
General
Purpose
Introduction of methods that enable advantageous trading with Nikkei 225 futures
Instruments
Nikkei 225 futures (mini)
(Monthly expiries are large near-months: March, June, September, December)
Development Concept
- Be able to visually reproduce with few indicators
- Support automated trading using AutoRE225 Cloud Service
- Be a principled method that can be continuously utilized in the future
- Remain within a range that preserves mindset even if temporary losses occur
- Do not use high-risk methods like averaging down or low-level methods such as hedging
Notes
Copyright
This book is protected by copyright law. Please comply strictly with the following points regarding handling.
- Unauthorized use, reproduction, or resale by any means is prohibited.
- Reproduction is allowed only for non-commercial personal use.
However, please take measures to ensure that a third party cannot view it.
Financial Risk
This logic introduces a method for advantageous trading, but does not guarantee future profits. If losses occur, you are responsible, so please exercise your own judgment ultimately.
Nikkei 225 Futures
Nikkei 225 futures are derivative transactions based on the Nikkei Stock Average as the underlying asset, listed on exchanges such as the Osaka Exchange.
Instrument Types
There are Nikkei 225 futures (Large) and Nikkei 225 Mini; the Mini is one-tenth the size of Large. Individual investors with less capital typically trade Minis. The main differences between the two are shown in the table below.
| Type | Tick Size | Contract Size | Expiries | Margin |
|---|---|---|---|---|
| Large | ¥10 | ¥10,000 | Multiples of 3 months | About ¥1,500,000 |
| Mini | ¥5 | ¥500 | Every month | About ¥150,000 |
Margin requirements fluctuate. Typically they are about 5–6 times the price index.
Trading Hours and Trading Days
Trading days for Nikkei 225 futures begin at 16:30 on the previous business day.
| Section | Open–Close | Time |
|---|---|---|
| Day Session | 8:45-15:15 | 6 hours 30 minutes |
| Night Session | Prev 16:30-6:00 | 13 hours 30 minutes |
| Trading Days | Prev 16:30-15:15 | 20 hours |
The day session is also called the regular market, and the night session the after-hours market.
Features
Nikkei 225 futures have the following features and are relatively approachable trading vehicles.
- No need to select specific stocks or currency pairs like stocks or FX.
- Unlike physical stocks, profits can be made when prices go down.
- Very low commissions allow for even small gains to be covered.
- Less likely to produce unpredictable price spikes like in FX.
It is an easy-to-understand mechanism, but not everyone can make money. Trading is zero-sum: the total of profits and losses equals zero. If many professionals win, many amateurs lose, so to become part of the winners you must adopt correct trading methods.
Glossary and Charts
Explanation of commonly used trading terms and charts.
OHLC and Candlesticks
OHLC
There are four values: open, high, low, and close.
| OHLC | Meaning |
|---|---|
| Open | Value at the beginning of the time unit (bar) |
| High | Highest value within the time unit (bar) |
| Low | Lowest value within the time unit (bar) |
| Close | Value at the end of the time unit (bar) |
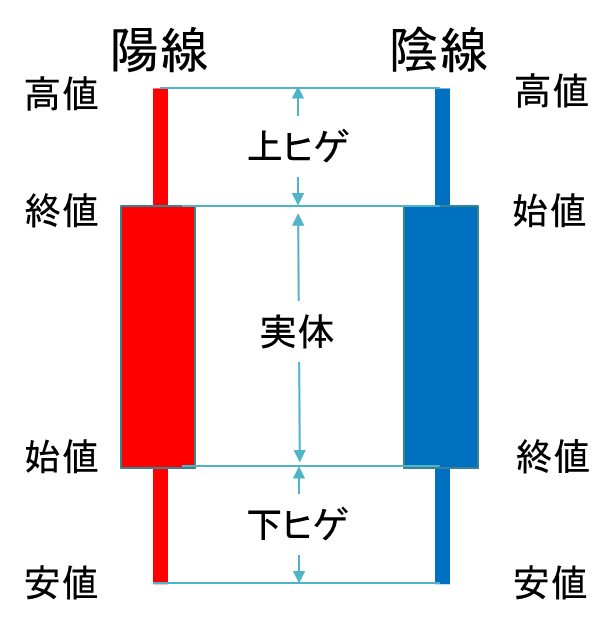
Candlesticks
A graphical representation of OHLC values for charting.
| Type | Meaning |
|---|---|
| Bullish | Close higher than open |
| Bearish | Close lower than open |
Charts and Technical Indicators
Charts
Charts plot price movements over time in sequence.
Technical Indicators
Indicators such as moving averages and Bollinger Bands analyze past price movements to forecast future movements; they are also called indicators.
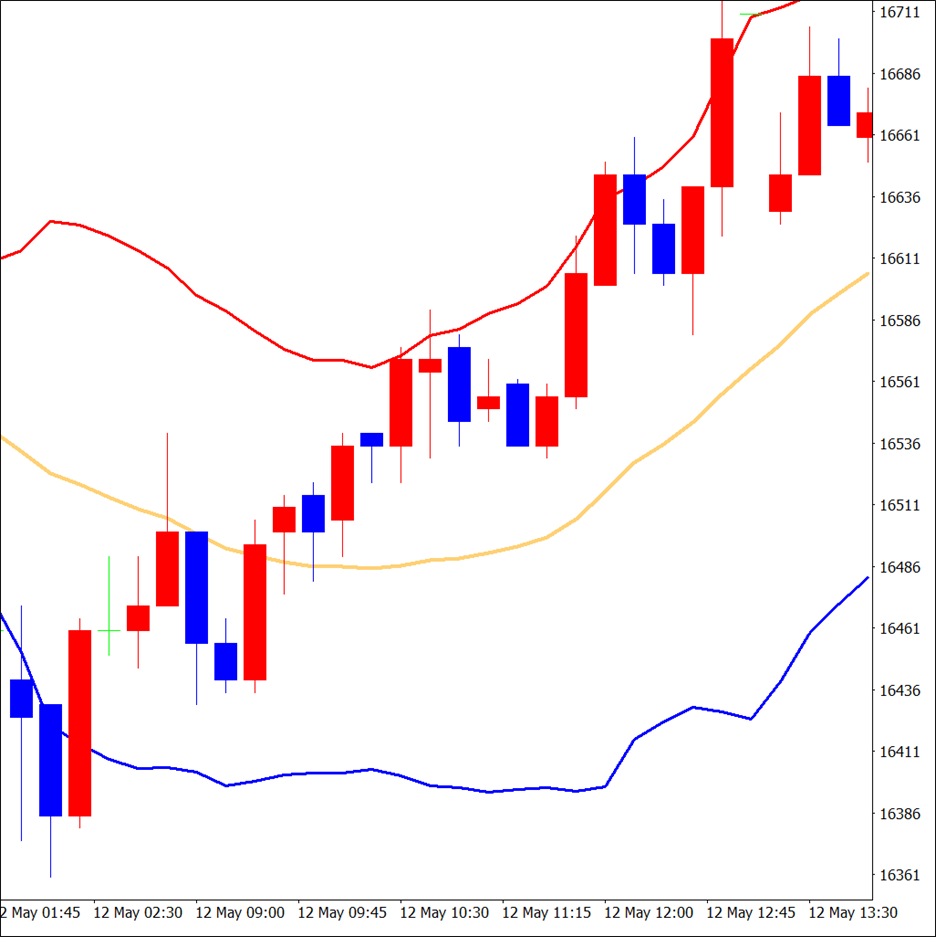
Moving Average (orange line on the chart)
Average of past closing prices over a fixed period
There are simple, weighted, and exponential moving averages, but this book uses Simple Moving Average (SMA) and may simply refer to it as Moving Average (MA).
Bollinger Bands (the area enclosed by red and blue lines on the chart)
MA over a past fixed period ± coefficient × standard deviation (σ)
Also written BB±nσ; the table below shows the probability corresponding to each coefficient.
| BB | ±0.5σ | ±1.0σ | ±1.5σ | ±2.0σ | ±2.5σ | ±3.0σ |
|---|---|---|---|---|---|---|
| Existence probability | About 38% | About 68% | About 86% | About 95% | About 99% | About 100% |
The coefficient is often 2.0, and this book also uses 2.0 (95%).
Market Perspective
Market perspective is broadly divided into trends and ranges, with trends having uptrends and downtrends.
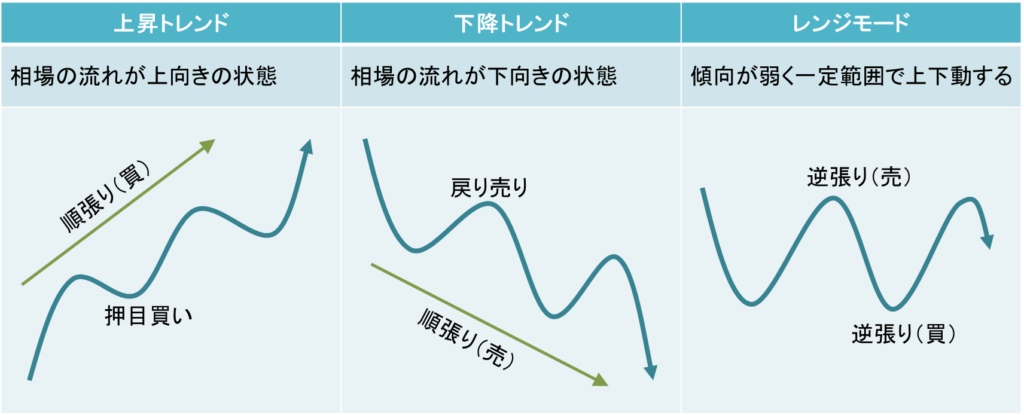
As shown in the figure, even during a trend, there can be temporary moves in the opposite direction, called adjustments.
Trading Terminology
Trending vs. Reversing, Buy on Dips and Sell on Rallies
| Item | Content |
|---|---|
| Trending | Buy/sell in line with the trend (also called trend following) |
| Reversing | Trading against the trend during range-bound or extreme moves |
| Buy on Dips | Buy when prices temporarily dip in an uptrend |
| Sell on Rallies | Sell when prices temporarily rise in a downtrend |
| ※ Buy on dips and sell on rallies are basically trending in the long term and reversal in the short term. |
Opening and Closing, and Order Book Matching
| Item | Content |
|---|---|
| Opening (with) | The first price after trading starts or that price Daytime opening (08:45), Night opening (16:30) |
| Closing | The last price when trading ends or that price Daytime closing (15:15), Night closing (06:00) |
| Order book matching method | A method where orders placed before opening and within five minutes before closing are considered to be entered at the same price and matched simultaneously at the opening or closing time |
| ※ For equities, daytime (regular market) is split into morning and afternoon sessions, each with opening and closing quotes; the afternoon close is called the "late close." |
Other Trading-Related Terms
| Item | Content |
|---|---|
| Entry | Start a trade (establish a position) |
| Exit | End a trade (repayment, settlement, exit) |
| Execution | Trade is executed |
| Entry Price | Price at entry |
| Position | An open position not yet exited (long or short) |
| Unrealized Profit | Position is in profit but not yet realized |
| Unrealized Loss | Position is in loss but not yet realized |
| Market Order | Place an order at the current market price |
| Limit Order | Place an order with a pre-specified price |
| Stop Price Order | Buy high or sell low with an order price opposite to the usual (reverse limit) |
| Limit Order (LO) | To take profit or a limit order |
| Stop Order (SO) | To cap losses or stop-out, stop-loss, reverse stop, or loss cut |
| Drawdown | Cumulative loss |
Trading Preparation
Opening a Securities Account
As long as you trade Nikkei 225 futures, any securities company is fine, but to engage in auto trading with AutoRE225, please open an account with one of the following:
- au Kabucom Securities
- Okasan Online Securities
- SBI Securities
Operating Capital
The minimum trading unit for Nikkei 225 futures is one Mini. Considering margin, cumulative losses, and potential losses, a minimum operating capital of about ¥300,000 is recommended.
Mindset
No one can predict the future. All one can do is forecast. And forecasts can be right or wrong. No perfect logic guarantees 100% success. No one trades hoping to lose, so unless you trade with superior methods, you cannot earn profits.
What I want to stress is to always keep in mind that you will lose at times. Some people refuse to settle to avoid realizing a loss, but it is better to cut losses early and focus on the next trade, which ultimately grows your capital.
When you lose, reflect on why you lost. If there is a reason, analyze it and add or modify rules to prevent repeating the same mistakes, then validate again.
Similarly, when you win, stay disciplined. Getting complacent and taking reckless trades can wipe out gains. This is something everyone experiences.
Make this method your core framework, and diligently adhere to its rules. Do not forget this.
Conclusion
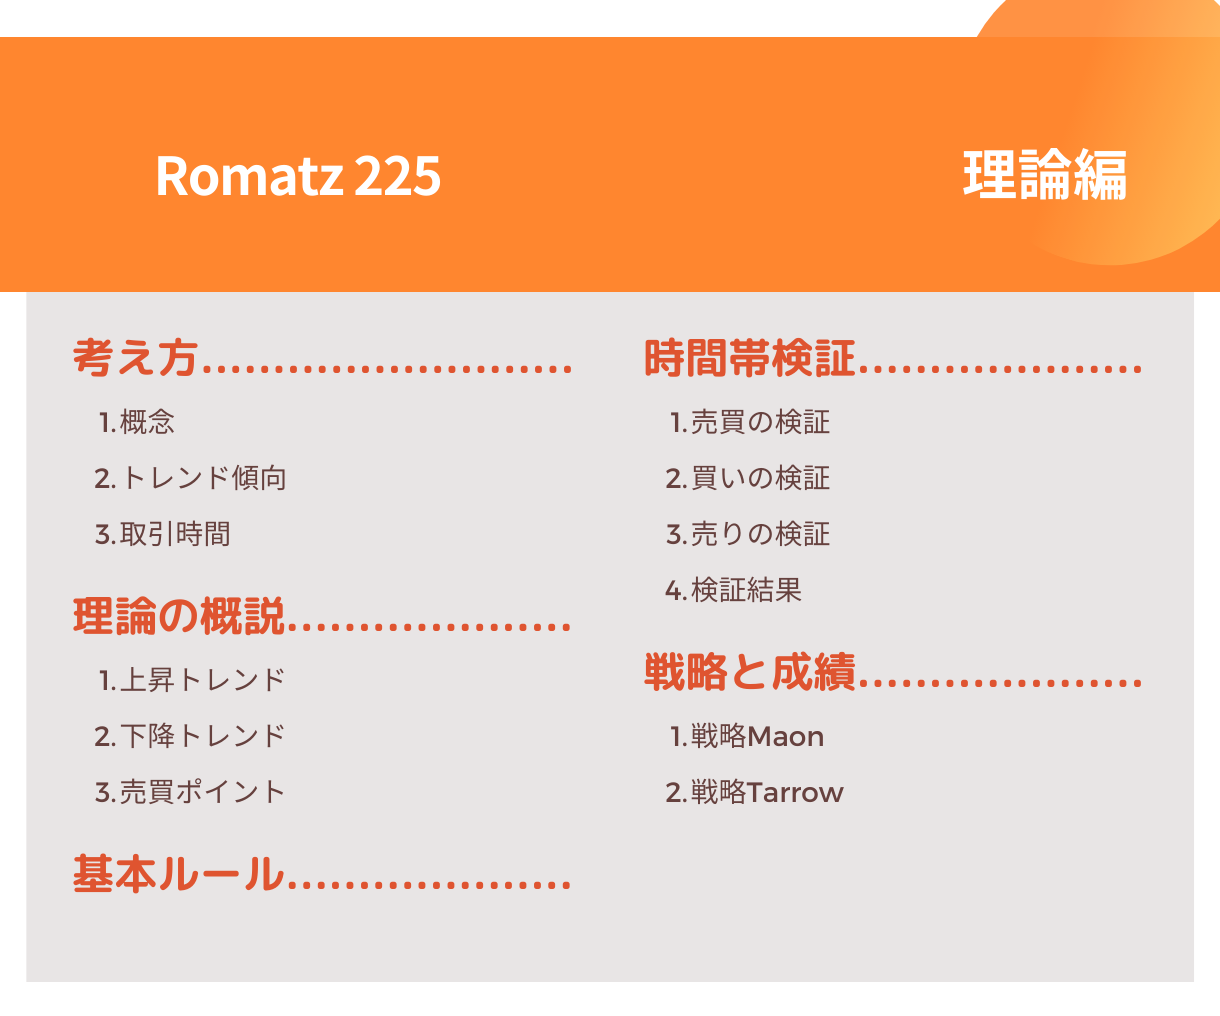
That completes the Basic section. With the foundational knowledge and preparation gained so far, you will move on to the Theory Explanation to learn Romatz225's specific analysis contents and operating procedures.