

Use of the “Visualization Indicator” (Part 59)
Usage of the "Visualization Indicators" (part59)
1. Develop and enhance the "28 Currency Pair List Indicator" into an indicator
“8CPVisualization Indicator”to drawCADJPY
“8CPVisualization Indicator” includesOceania version,London version,NewYork version,AnyCP version. This time, we used theNewYork version.
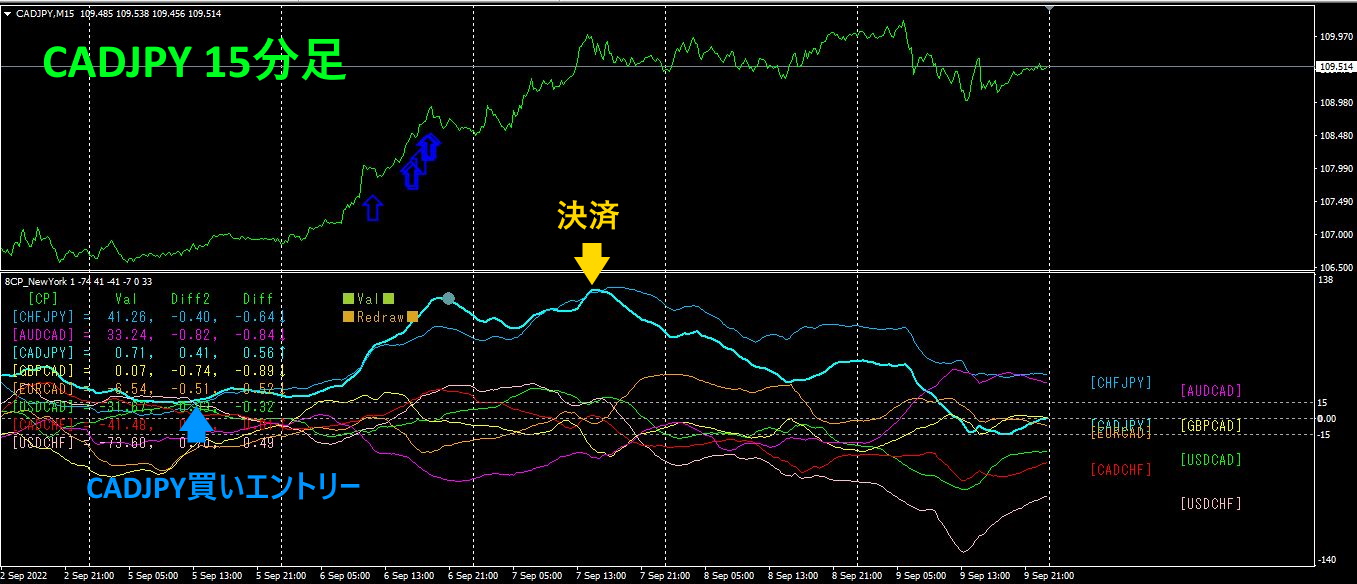
The top half is theCADJPY 15-minute chart. The blue arrow at the top half indicates the alert position of the "28 Currency Pair List Indicator." The bottom half is the "8 CP Visualization Indicator." The light blue thick line graph corresponds toCADJPY.
On Monday, the CADJPY graph of the "8 CP Visualization Indicator" rose above the other graphs. If you had opened a buy position here and closed on Wednesday, you would have gained approximately320PIPS of profit. A buy from the alert position of the “28 Currency Pair List Indicator” would have also yielded ample profit.
2. Best SelectTry the Indicator
The following figure is a screenshot taken onSeptember,2022 year6 day21:58
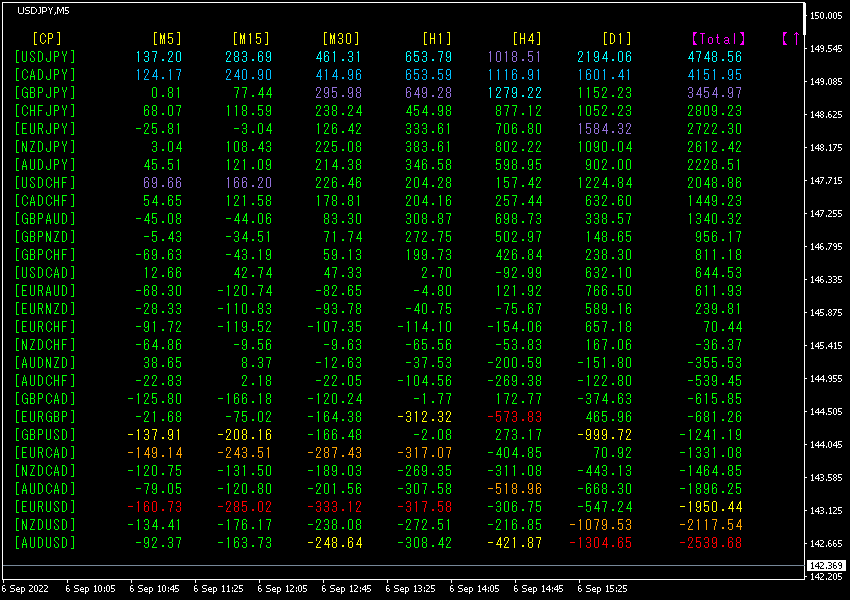
TotalNumbers are sorted in descending order. The very top row showsUSDJPY,[M5],
[M15],[M30],[H1],[D1],[Total] are in light blue. [H4] is also shown in blue tones, and the value of Total is4748.56, indicating a strong upward trend in USDJPY.
Now, let's look at the USDJPY chart.
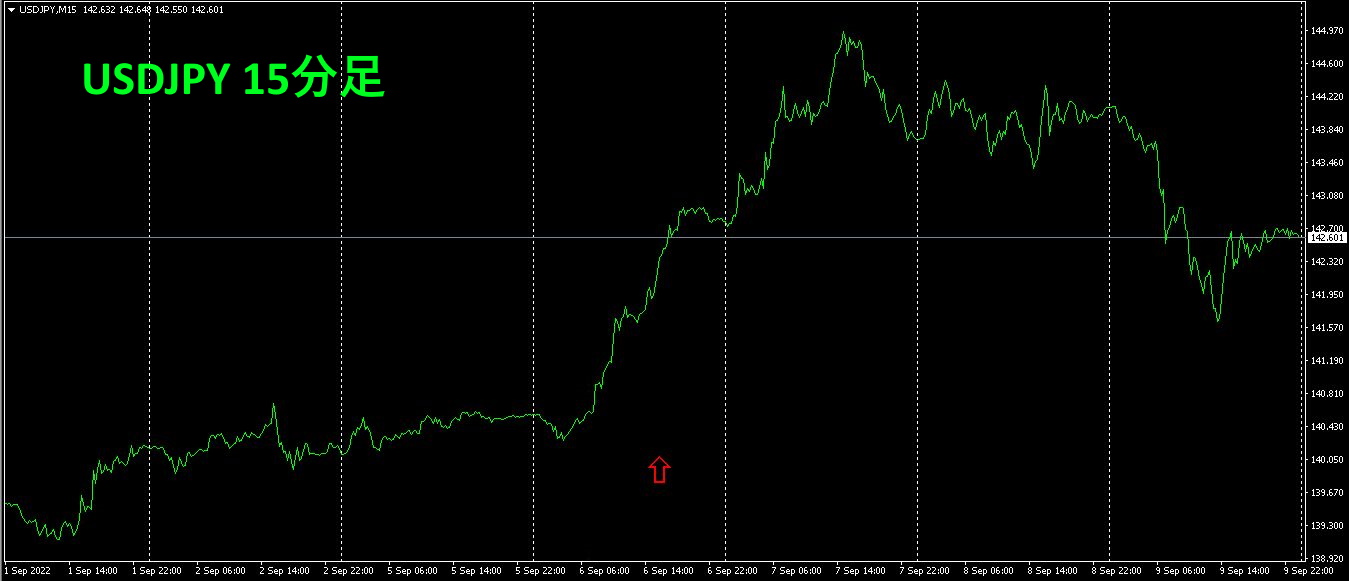
The upward red arrow marks the position at which the screenshot was taken. The red arrow position is in the midst of a strong uptrend. Currently, due to the strong USD and weak JPY, the yen continues to weaken. By simply holding a buy position through the next day, you could have earned about270PIPS in profit.
3. What happened to EURJPY, which has been tracked since last May?
We have been following the movement of EURJPY since May,2021 year5 month.
To view the overall trend, a 30-minute chart shows roughly the recent3 weeks.
Previously, it was written as follows.
From the most recent low, it has already risen more than500PIPS, so the upside seems slightly heavy. There is still room to rise, but going forward, the scenario is likely to be attempts to rise but with limited growth.
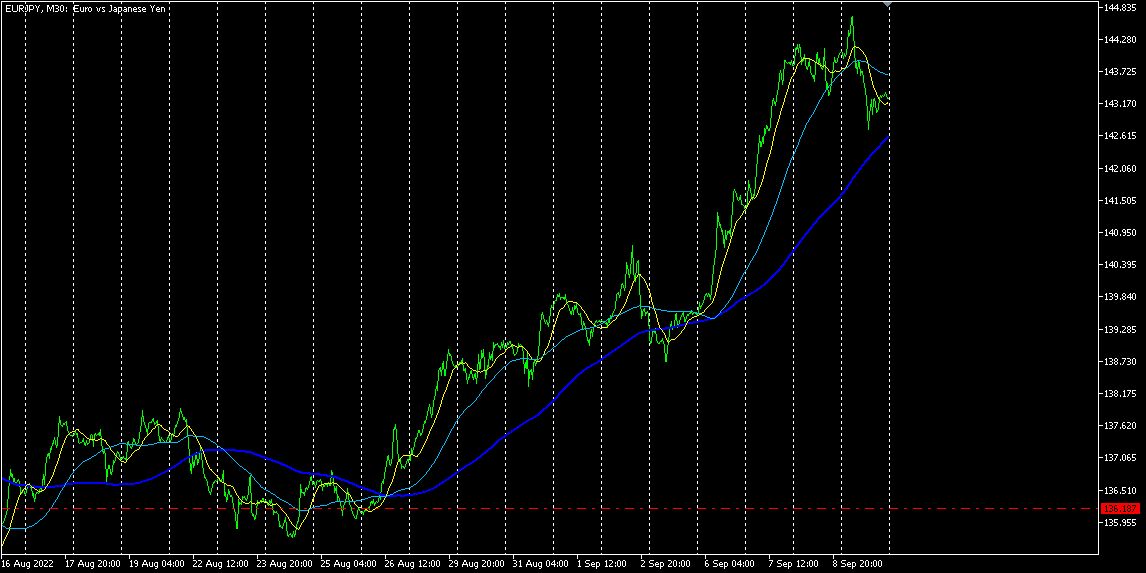
It has risen further.JPY is weak, soEURJPY rises.
4Please refer to the hourly currency strength chart.
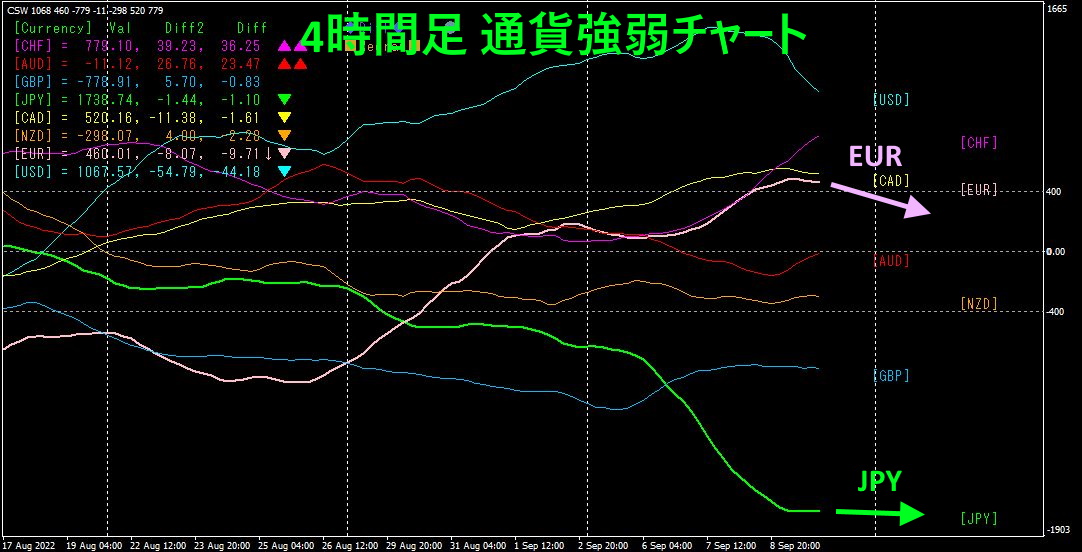
Pink showsEUR, green showsJPY. JPY was the weakest, but it is slightly downward, almost horizontal. On the other handEUR is positioned aboveJPY, but the downward angle is steeper than that ofJPY. The future trend suggests thatEURJPY may move slightly downwards.
If you are interested in the “8C Currency Strength Visualization Indicator,” please refer to the following page.
MT4 version https://www.gogojungle.co.jp/tools/indicators/39150
MT5 version https://www.gogojungle.co.jp/tools/indicators/39159
【My items for sale】


