

Central Plains Shun Report September Special Issue 2023 US Long-Term Interest Rate Forecast September 7, 2022
1. Long-term cycle of US interest rates
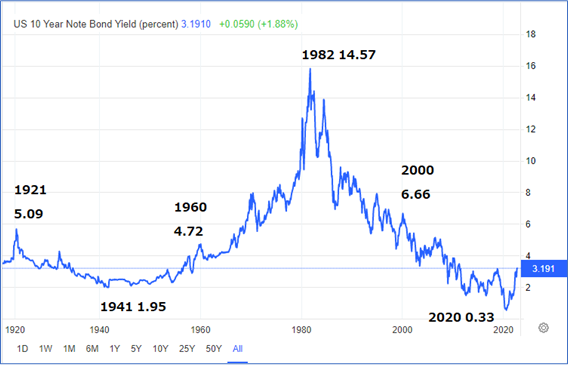
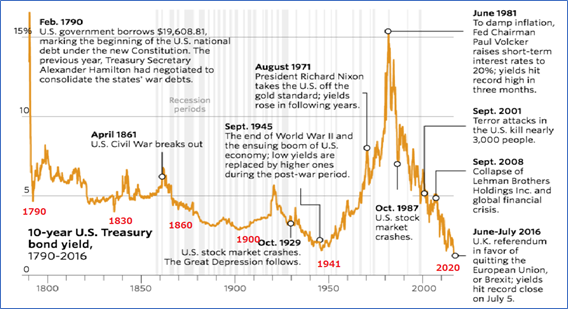
The U.S. long-term interest rate has reached important bottoms roughly every 80 years, and then every 40 years (range 33–47 years), which is half of that period. The historical bottoms occurred around 1790 and 1830, 1901, January 1941, August 1986, and probably March 2020 at 0.33%. There also seems to be a tendency to form notable tops and bottoms every 20 years. The next significant top is likely around 2040.
Since it fell below 1% in 2020, it is highly likely that March 2020 was that historical bottom—though, as noted above, the time window for a cycle bottom could extend to 2023, and if events such as a pandemic or financial panic occur, the March 2020 rate could be updated (for example, to zero for a 10-year maturity, etc.).
Also, the bottom is likely symmetric around 1982 (in time). If this hypothesis is correct, rates would have a 40-year up cycle and a 40-year down cycle starting from 1982. A 40-year range is about 7 years, so the range is approximately 33–47 years, and the 0.397% on March 9, 2020 falls within the cycle’s orbit 38 years from the top. However, until 2029 there remains a possibility that rates could still push to a new low.
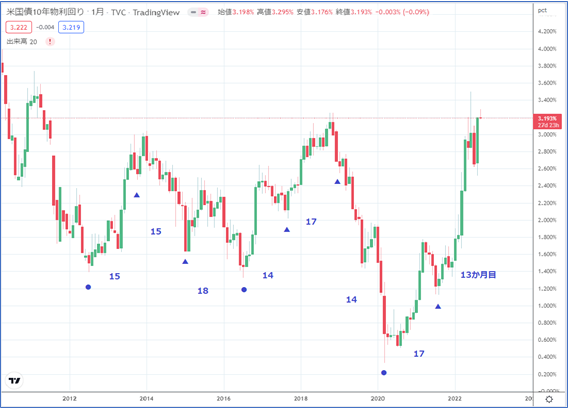
(● = 39-month cycle, ▲ = 15.5-month cycle ±2.5 months)
2. Long-term cycle
The 20-year US rate cycle (roughly 17–23 years) is assumed to consist of four to six cycles of 3–5 years. The previous 3–5 year cycle bottomed in July 2016 after 4 years.
A 3–5 year cycle averages 38.3 months across twelve cycles since June 1977—roughly a 39-month cycle. March 2020 was within the expected range, as was July 2020 (July 2019–July 2021). Therefore, the bottom occurred in roughly the expected time frame.
Also, a 39-month cycle comprises two 20 months or three 15.5-month cycles; the most recent cycle has lengthened slightly to 15.5 ± 2.5 months. The two 39-month cycles since 2012 were formed from three 15.5-month cycles.
From March 2020, the new 39-month cycle bottomed after 17 months, on August 4, 2021. Even if the new 39-month cycle consists of three 15.5-month cycles or two 20-month cycles, the first phase remains bullish. The 20-year time period is valid, and if a lower bound has already been reached, 2020 would signify the completion of the long-term yield-down cycle that has persisted since 1982. However, there is still a possibility of one more 39-month cycle within the orbit. Two plausible scenarios for the future are:
1) The 20-year long-term downtrend completes and the 39-month cycle bottoms.
2) The 20-year long-term downtrend has not yet completed, but the 39-month cycle bottoms.
Consider the above two cases.
In case 1, the level would be around 0.39%, and perhaps not even trying 0.5%, with the base rate gradually rising. Initially it could be milder, but by 2022 a clear rate rise would form.
In case 2, since the ultra-long-term cycle has not yet bottomed, rates may rebound but not break from the previous 39-month cycle. Therefore the second phase (either a second 15.5-month cycle or a second 20-month cycle) is likely to left-transition or center-transition, implying limits to how high rates can rise.
In any case, the bottom of the first 15.5-month cycle is considered to be August 2021.
After that, in case 1, a persistent rise in rates would become clear, while in case 2, rate increases would be about half the cycle length—i.e., for an 15.5-month cycle, up to about 8 months, and for a 20-month cycle, about 10 months—followed by a larger decline in rates.
At present, the possibility of case 2 is nearly eliminated, but it still appears that the monthly close has not yet broken above 3.25%, so a small possibility remains. However, it is reasonable to conclude that case 1, i.e., the long-term rate bottom was March 2020, is the more likely scenario.
The current 13-month sub-cycle of the 39-month cycle is in its 13th month. With the somewhat longer 15.5-month cycle ±2.5 months, the bottom would arrive around mid-to-late November 2022, i.e., early September to early March 2022’s window. A peak in the 15.5-month cycle tends to occur one to two months earlier in a bullish scenario, so a long-term U.S. long-term rate peak may not have arrived yet, but we are entering the peak timing of the 13-month cycle. That said, rates could rise into early 2022 to 2023...
Please refer to the PDF for the continuation.
* Copying or distributing this report without authorization would violate your contract. If such violation is discovered, legal action may be taken, and even within the subscription period, distribution may be stopped. Thank you for your understanding.
* This report does not guarantee future outlook accuracy or profitability. Traders and readers should trade at their own risk. The author and issuer bear no responsibility for the decisions of participants in the market. Regardless of the instrument, physical, futures, and options trading are considered high risk.
* This report is for informational purposes only and does not constitutes buy or sell recommendations.