

Utilization of the "Visualization Indicator" (Part 58)
Use of the "Visualization Indicator" (its58)
1. Further develop the "28 Currency Pair List Indicator" and visualize
"8CP Visualization Indicator"to plotEURAUD.
There are versions of the "8 CP Visualization Indicator" for Oceania, London, NewYork, and AnyCP. This time, the Oceania version was used.Oceania版
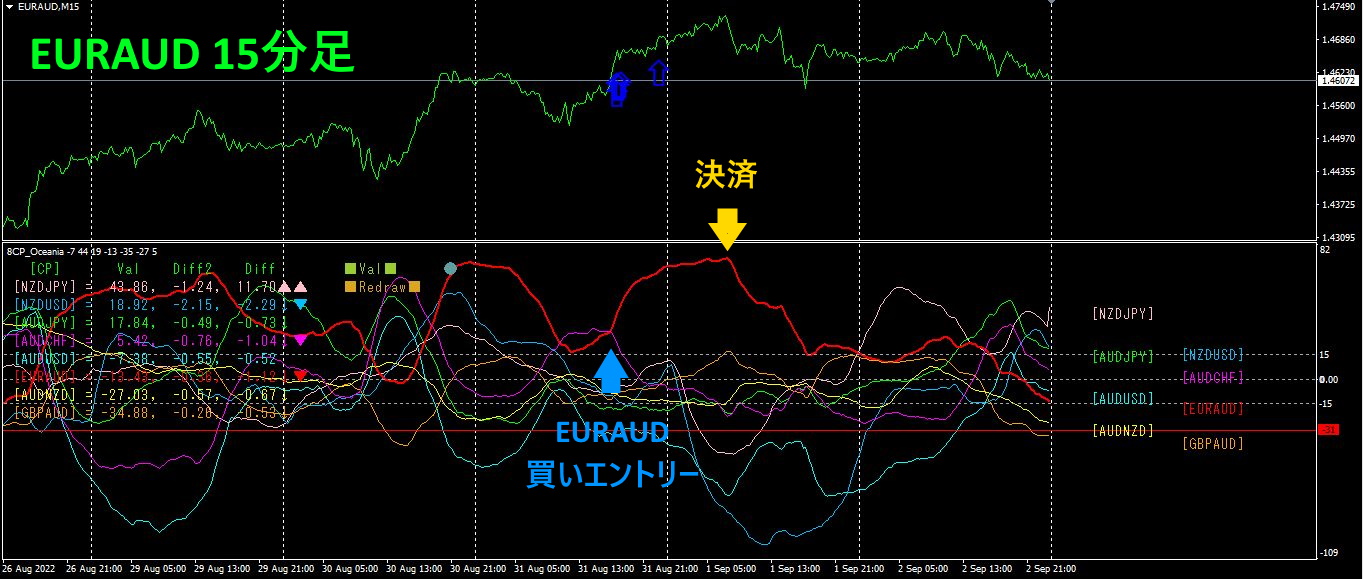
The upper half is the 15-minute chart ofEURAUD. The blue arrows in the upper half indicate the alert positions of the "28 Currency Pair List Indicator." The lower half is the "8 CP Visualization Indicator." The red graph corresponds toEURAUD.
On Wednesday night, the EURAUD graph of the “8 CP Visualization Indicator” rose above the other graphs. Here, if a long position had been opened and closed the next day,about150PIPS of profitcould be earned. A buy from the alert position of the "28 Currency Pair List Indicator" would also be profitable.
2. Best SelectUsing the Indicator
The figure below is a screenshot taken on2022 year8 month30 day18:04.
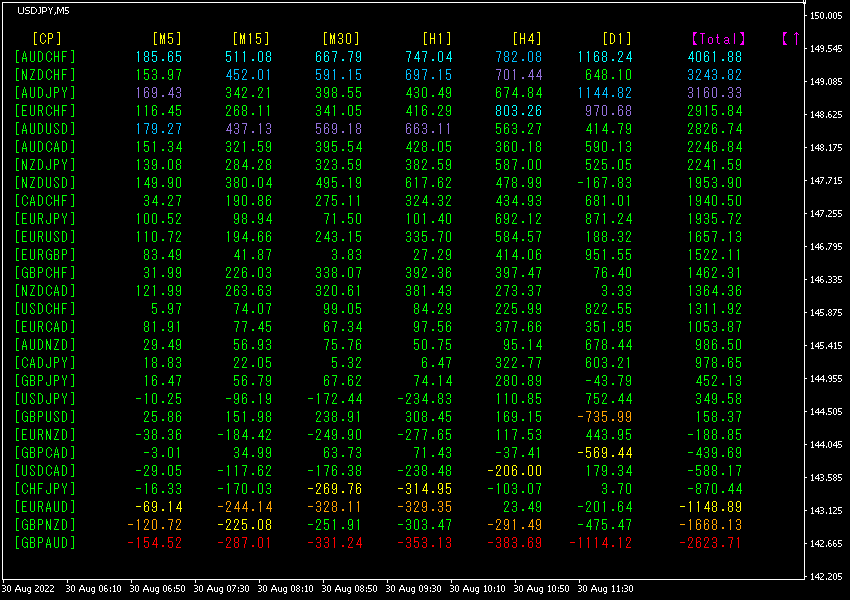
Numbers are sorted in descending order. The top row showsAUDCHF,[M5],
[M15],[M30],[H1],[D1],[Total] are shown in light blue. [H4] is also shown in blue tones, and the Total value is4061.88, indicating a strong uptrend for AUDCHF.
Now, let's look at the AUDCHF chart.
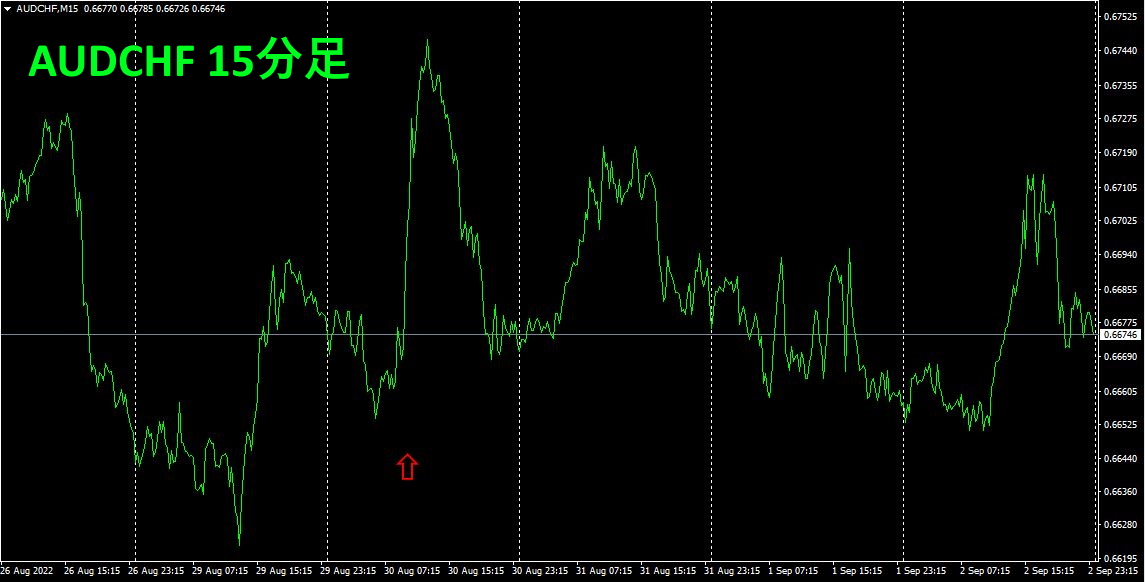
The downward red arrow marks the position when the screenshot was taken. A sharp rise followed from the red arrow position. About70PIPS of profit was earned.
3. Since May last year, how has EURJPY moved?
2021 month
To view the overall trend, a 30-minute chart showing about the last 3 weeks is drawn.
Last time I wrote the following.
The direction of the currency strength graph is not guaranteed to continue in that direction, but the trend is that JPY is flat, EUR is rising, so EURJPY should go up.JPY flat,EUR rising, so EURJPY will increase.
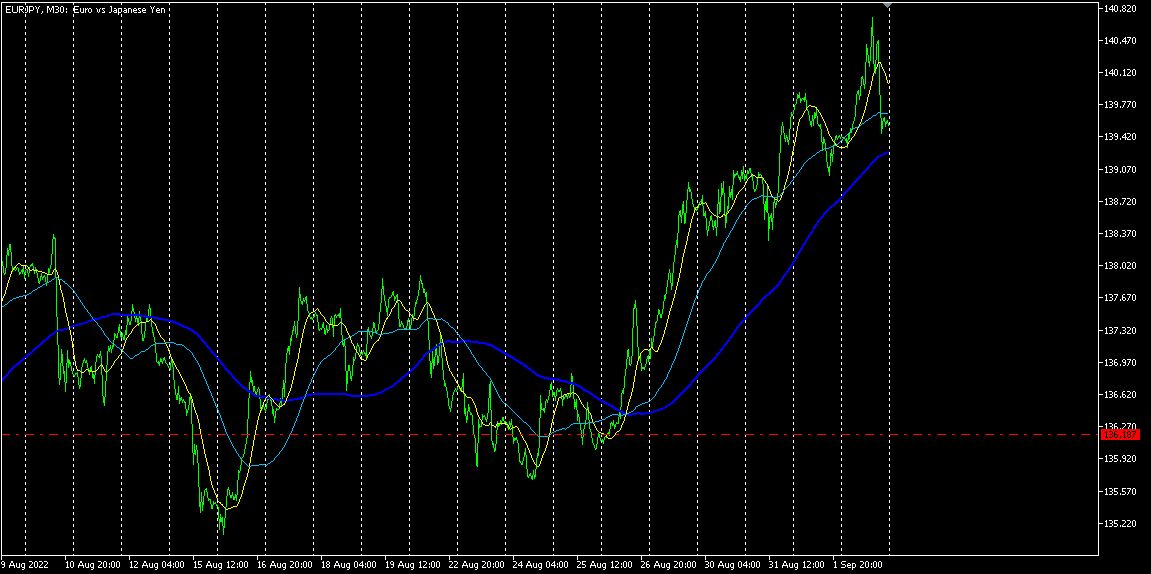
It moved up aggressively from Monday. It matched last week’s forecast.
Next, let us refer to the 4-hour currency strength chart.
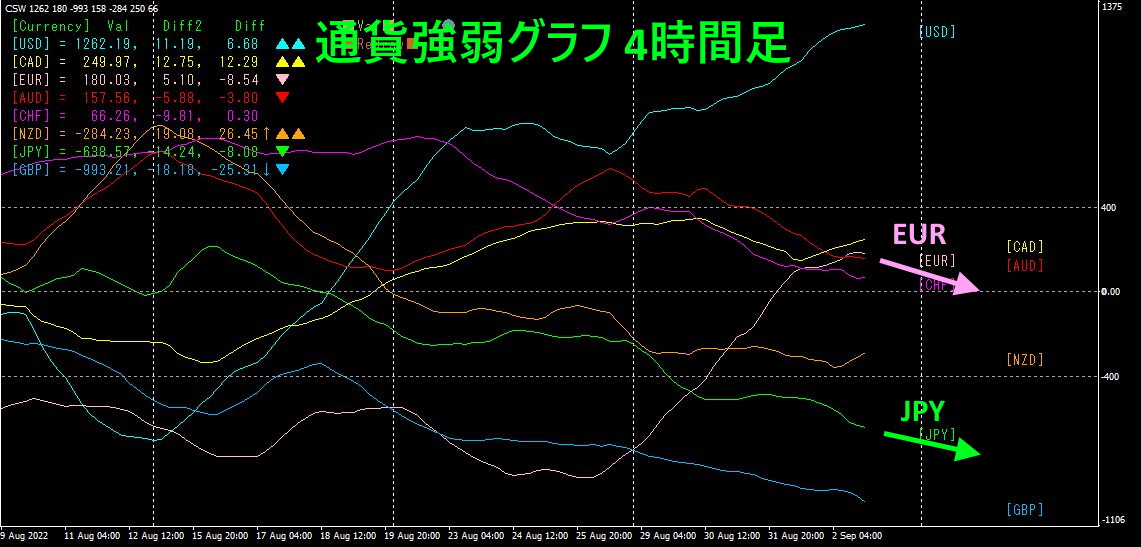
Until the end of last week, the weakest currency on the 4-hour chart wasEUR. However, since the start of this week,EUR has grown stronger, and the slope of the graph has risen steeply. In the latter part of the week, the rise has slowed.
4When viewing the currency strength graph on a 4-hour chart, the strongest currency isUSD, the weakest isGBP.EUR andJPY are moving downward.EUR andJPY compare in strength asEUR>JPY, but the angle of EUR is slightly more downward than JPY. EURJPY, which rose sharply, seems to be slowing down.
Let's look at the EURJPY 4-hour chart. The lower half shows the "8CP Visualization Indicator" London version. The pink thick line represents EURJPY graph.
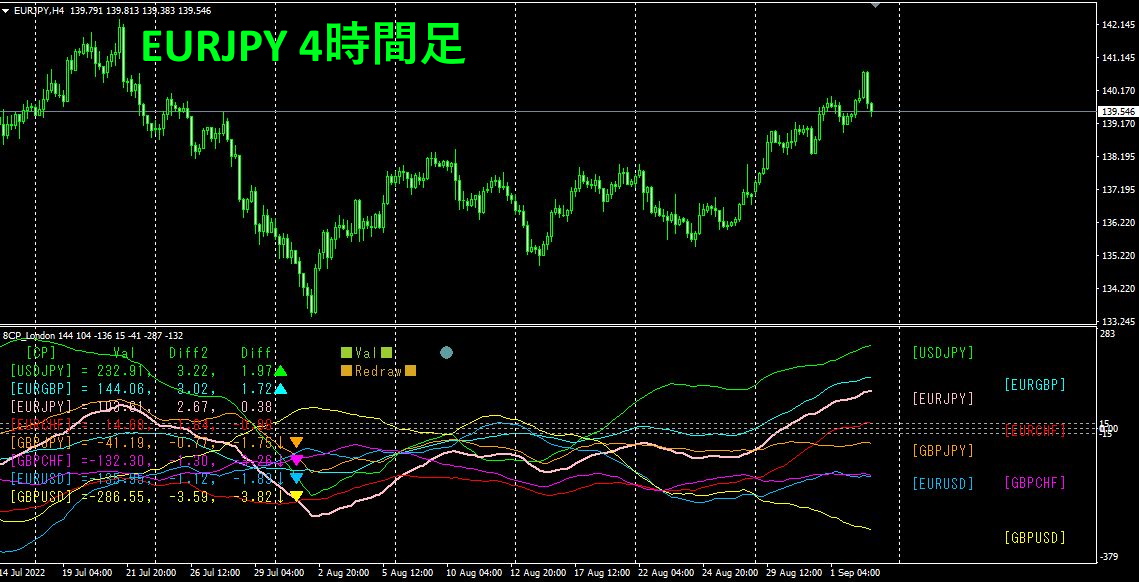
From the recent low, it has already risen by over500PIPS, so the upside is a bit heavy. There is still room to rise, but the future scenario is that it may try to rise but stall some.
If you are interested in the "8C Currency Strength Visualization Indicator," please refer to the pages below.
MT4 version https://www.gogojungle.co.jp/tools/indicators/39150
MT5 version https://www.gogojungle.co.jp/tools/indicators/39159
【My items for sale】


