

If you’re unsure whether to sell or buy, go with the GMMA trend direction!
Hello!
Inquiring about FX, I am Satori.
This time, if you’re unsure whether to sell or buy, wouldn’t GMMA trend direction be a good guide?
I will introduce an example of such signals.
The figure below shows a buy signal example for USD/JPY on a 15-minute chart.
On the main chart above, the N-shaped entry indicator is displayed.
Also, on the sub-chart above, the GMMA GAP indicator is displayed.
At step ①, GMMAShort blue slightly turns up and catches the GMMALong pink, turning positive; then at step ②, the N-shaped entry indicator turns positive, so it is considered a buy signal.
Steps ① and ② can occur in any order (either first or second).
The figure below shows a sell signal example for USD/JPY on a 15-minute chart.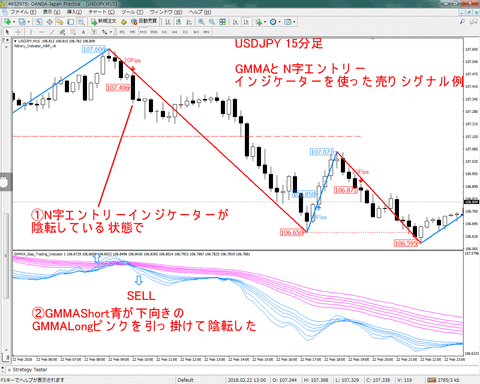
On the main chart above, the N-shaped entry indicator is displayed.
Also, on the sub-chart above, the GMMA GAP indicator is displayed.
After step ①, where the N-shaped entry indicator turns negative, step ② catches the GMMAShort blue with the GMMALong pink turning downward, and then turns negative, so it is regarded as a sell signal.
Steps ① and ② can occur in any order (either first or second).
Once you become accustomed to the relationship and shapes of the six GMMAs (GMMAShort and GMMALong EMAs), it will be easier to determine the trend.
GMMA works well with various indicators, so please consider incorporating it.
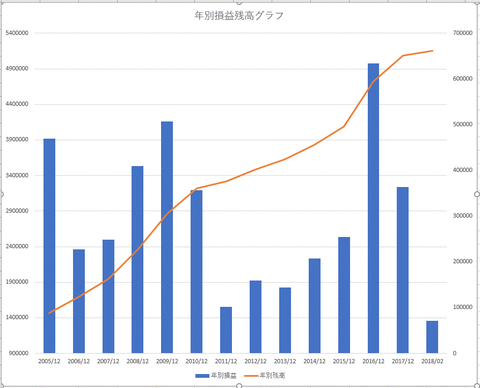
By the way, I’ll also introduce an example of a tool EA that has remained undefeated for 13 years using GMMA trend.
Because it is a tool, those who purchase it will have access to the logic.
Annualized, there have been no losses in 13 years.
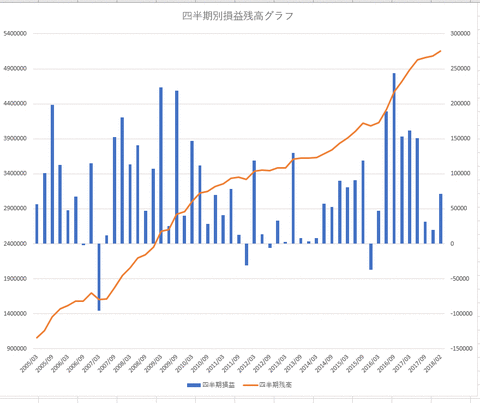
Quarterly, the win rate is 90%.
The EA and indicators related to this article are as follows.
MT4 GMMA Gap Trading Indicator (displayed on sub-chart)
http://fxmt4indicator.abproducts.biz/wp/?page_id=2153
MT4 GMMA MTF EMA Indicator (displayed on main chart)
http://fxmt4indicator.abproducts.biz/wp/?page_id=1463
USDJPY 15-minute Day trading・Scalping Tool EA 5-logic set
http://fxmt4indicator.abproducts.biz/wp/?page_id=2490
Thank you very much for reading this far today as well.
(Results are at your own risk.)
※ As a basic policy, consciously set your stop-loss level, and extend profit-taking as much as possible when you can. The profit-taking range should be larger than the stop-loss width; ideally at least twice the stop-loss width.
※ If you think you won’t profit more than the stop-loss width, it’s better not to enter.
※ Improve your experience by making appropriate minor adjustments to establish your own method.
・Trend is judged with 6 long-term and 6 short-term EMAs; GMMA, which works well with various indicators, is recommended.
・When GMMALong is rising and GMMAShort dips once (turns negative) and then catches GMMALong and rises again (positively), if the candlesticks turn upward in an N shape, consider buying (the same applies inversely for selling).
There are two GMMA indicators listed below.
MT4 GMMA Gap Trading Indicator (displayed on sub-chart)
http://fxmt4indicator.abproducts.biz/wp/?page_id=2153
MT4 GMMA MTF EMA Indicator (displayed on main chart)
http://fxmt4indicator.abproducts.biz/wp/?page_id=1463
・If you use the N-shaped entry indicator in a short-term spot setting for a trend following approach, with USDJPY 15-minute chart OCO for a buy, take profit 20 pips, stop loss at the previous valley minus 1 pip.
・A trend is considered up when the previous previous peak is higher than the peak before it and the previous valley is higher than the valley before it (including equal values).
※ However, there is noise due to fluctuations, so considering high/low prices up to about three bars back can improve accuracy.
・All of the above operations are automated by the N-shaped entry tool EA.
・When using the Fibonacci Retracement indicator in a short-term spot setting, for USDJPY 15-minute chart OCO buys, take profit 20–50 pips, stop loss at the previous valley minus 1 pip.
・A trend is considered up when the previous previous peak is higher than the peak before it and the previous valley is higher than the valley before it (including equal values).
※ However, there is noise due to fluctuations, so considering high/low prices up to about three bars back can improve accuracy.
・All of the above operations are automated by the Fibonacci Retracement Auto Trade Strategy EA.